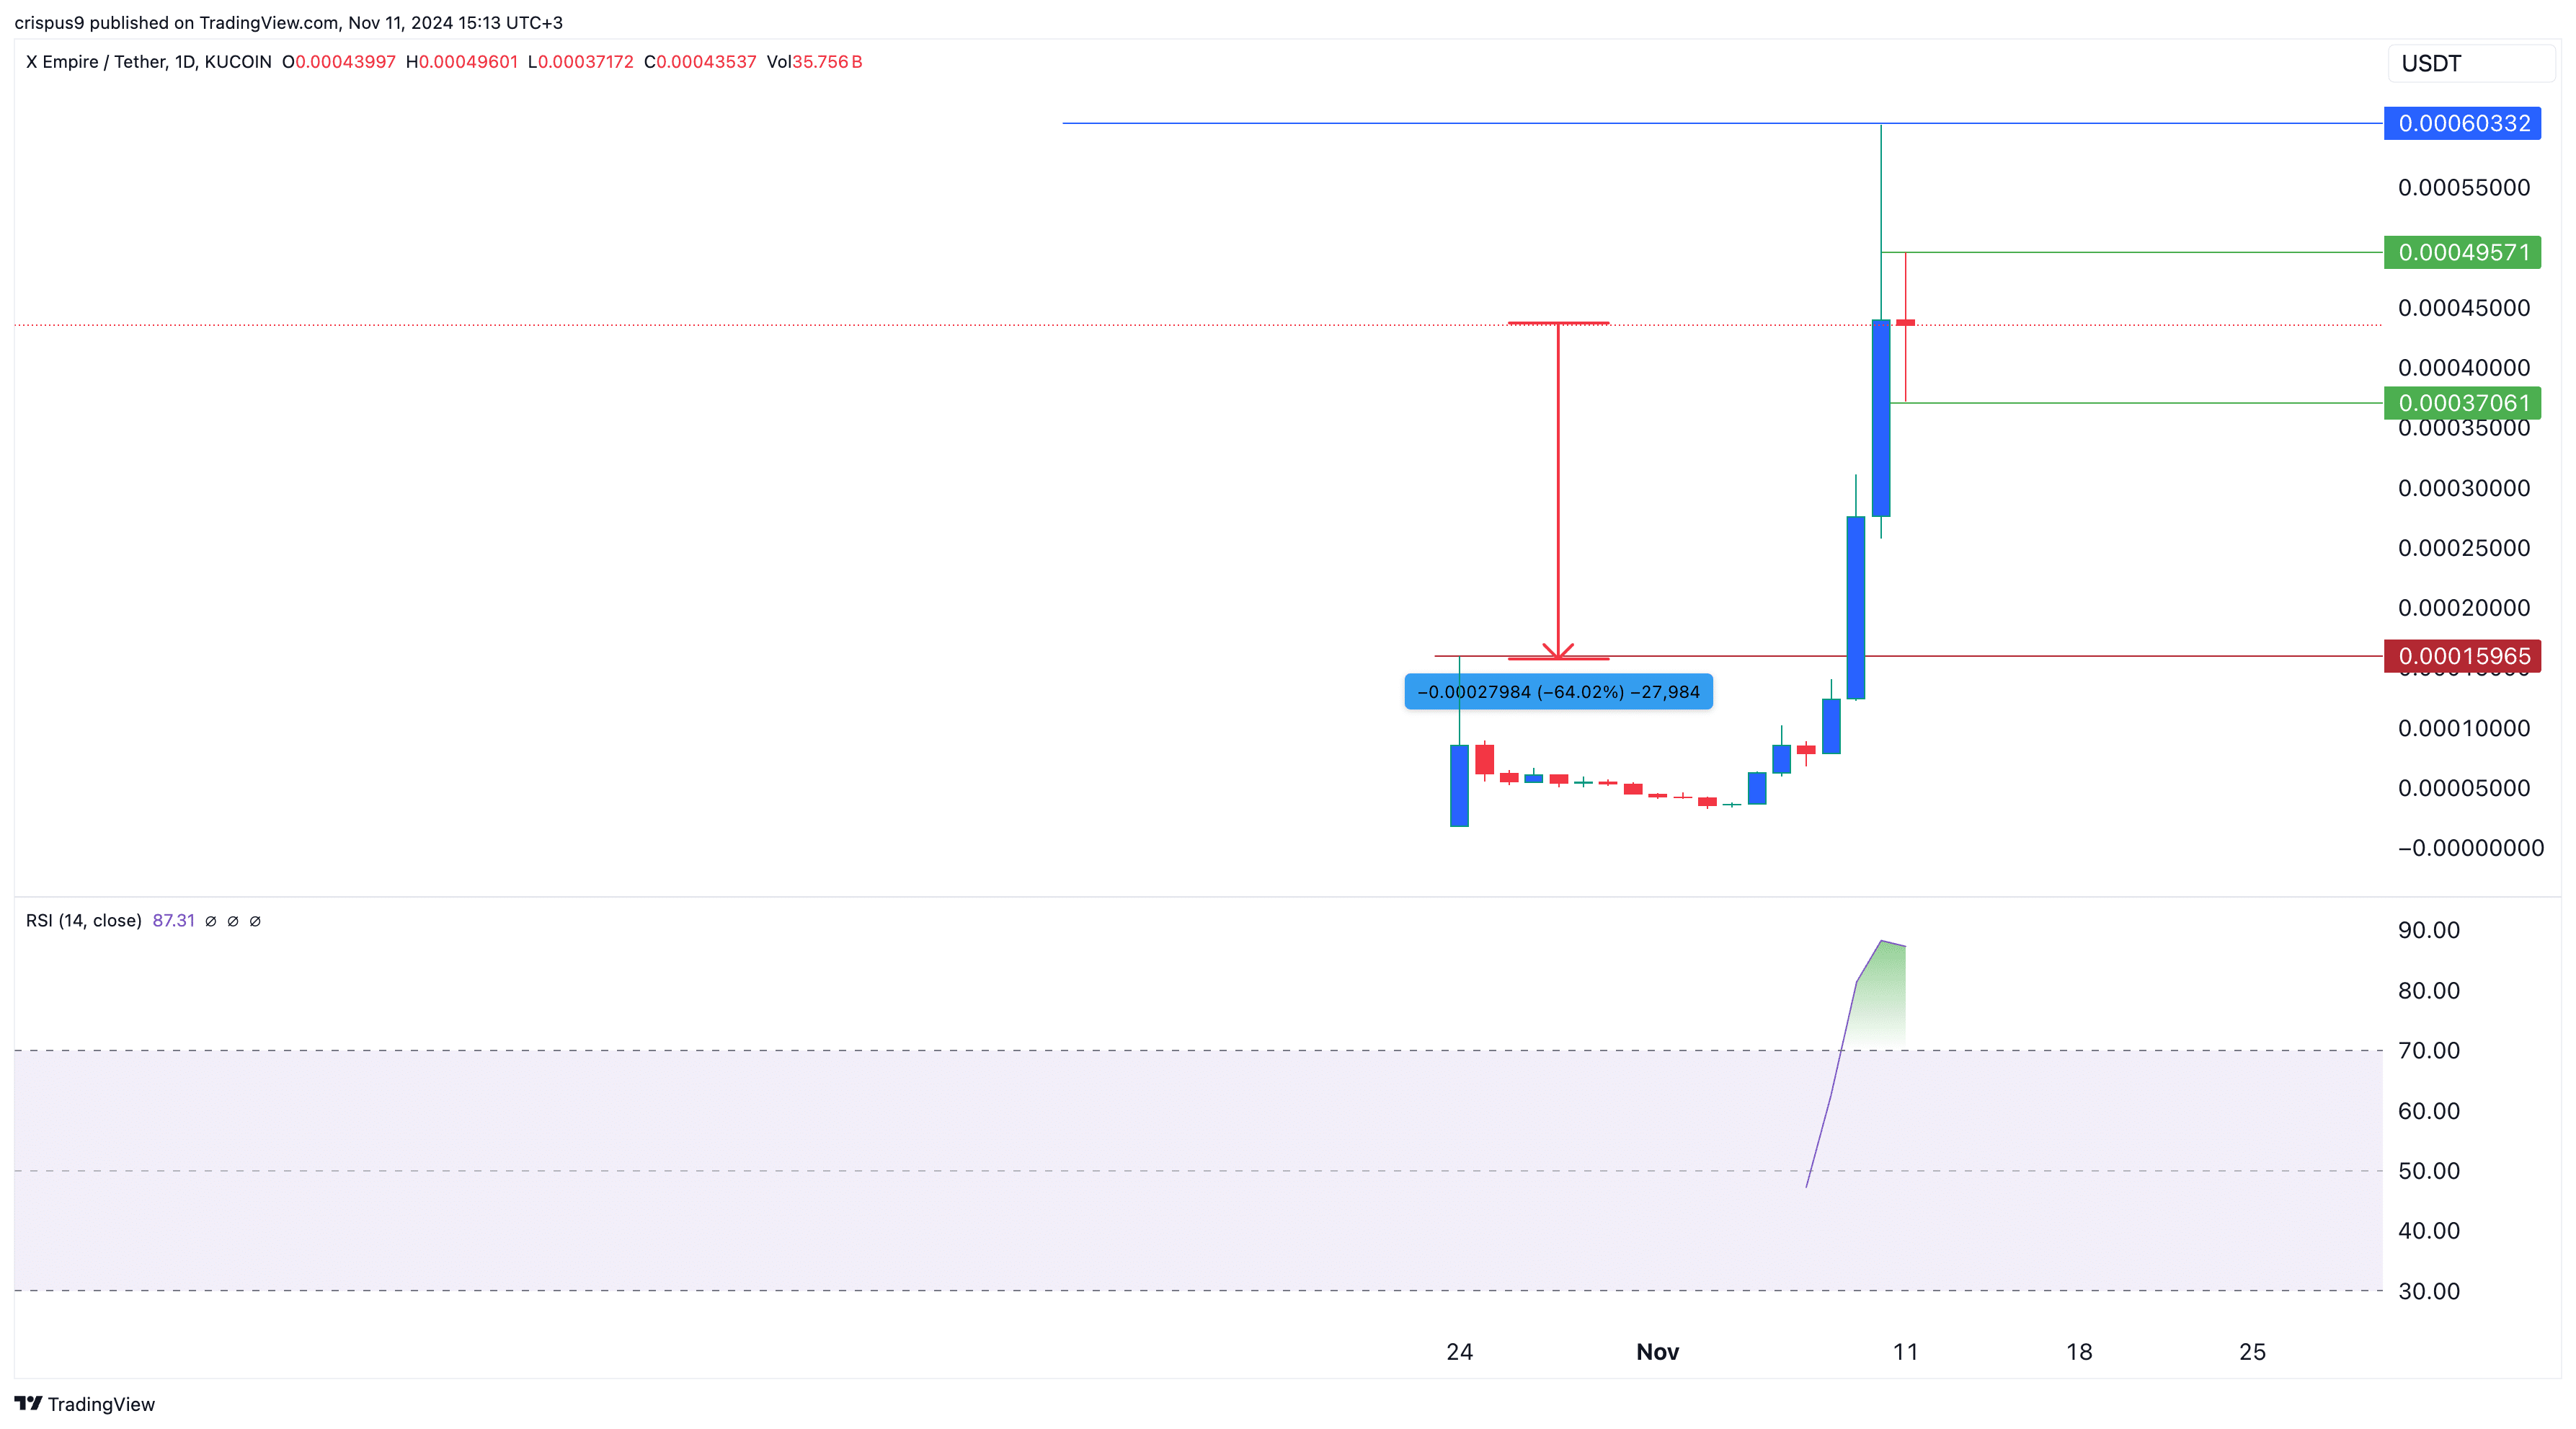
X Empire price has gone parabolic since earlier this month, becoming one of the best-performing cryptocurrencies in the market.
X Empire (X) token surged to a high of $0.000603 on Sunday, Nov. 10, representing a 2,917% increase from its lowest level this month. Consequently, its market cap rose to $302 million, while the 24-hour trading volume reached an impressive $1.64 billion.
The surge in the X token’s price occurred as investors celebrated Donald Trump’s presidential election victory and Elon Musk’s potential involvement in the administration. According to reports, Musk participated in a call between Trump and Ukraine’s Vladimir Zelensky and may consider advising the Trump administration as head of the Department of Government Efficiency.
Meanwhile, Musk’s wealth has surged, with his net worth jumping to over $314 billion, higher than the GDP of most countries.
To clarify, X Empire is not affiliated with Musk. However, traders have been drawn to its name, which was inspired by his ventures. Musk owns X, a popular social media platform, and Xai, an AI startup valued at over $6 billion.
X Empire is a Telegram game with over 50 million users and 300 million YouTube views. The game allows users to compete and earn X rewards that can be converted into fiat currency. Last week, the developers introduced AI avatars to the platform.
A potential catalyst for the X token’s price could be its listing on tier-1 exchanges such as Binance or Coinbase. Currently, most of its trading volume is on platforms like Bybit, OKX, Bitget, and KuCoin.
X Empire price is at risk of a big drop

On the daily chart, the X Empire token has risen for three consecutive days, reaching an all-time high of $0.00060 on Sunday.
While the data is limited, the Relative Strength Index has reached overbought levels, suggesting that the rally may be losing momentum.
There is a risk that the X token may be forming a doji candlestick pattern, characterized by a small body with long upper and lower shadows.
If the price ends the day at its current range of $0.00043, it would confirm the formation of a doji, indicating a potential reversal. Such a reversal could lead to a decline and a retest of the support level at $0.00015, its highest swing on Oct. 24, representing a drop of about 65% from the current level. This forecast would be invalidated if the price rises above Sunday’s high of $0.00060.
This article first appeared at crypto.news

