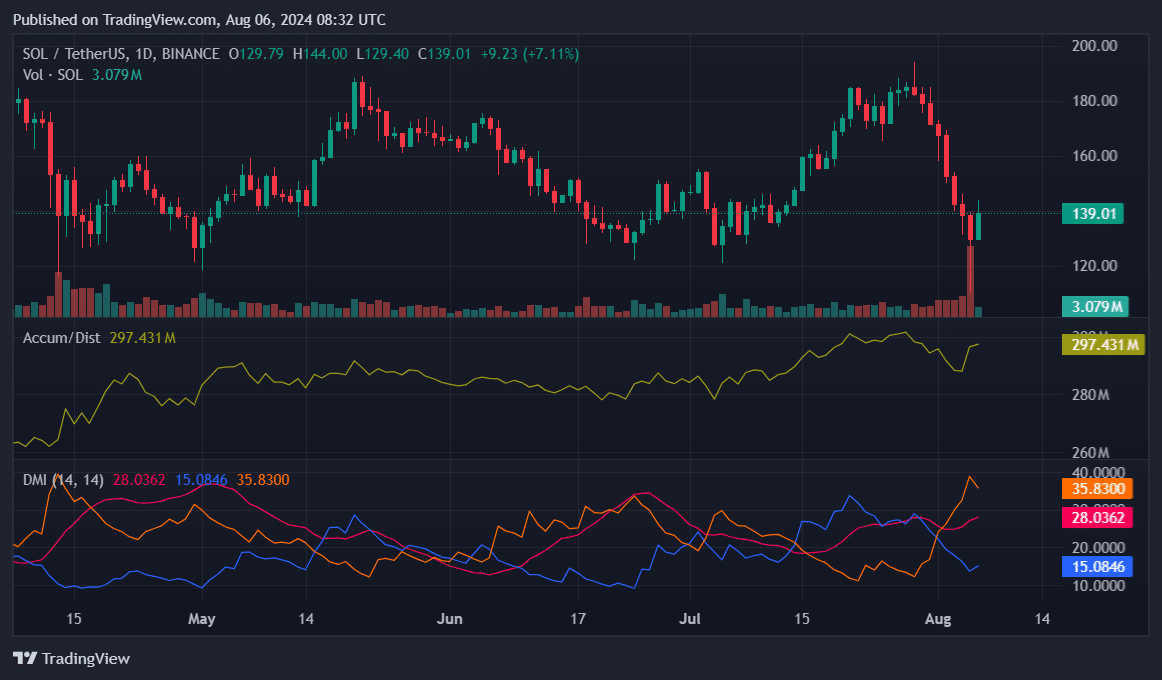
Solana is up 25% from the recent four-month low of $110 amid an impressive rebound, but market data shows mixed signals as bulls look to maintain the recovery push.
During the latest market-wide bloodbath that sent Bitcoin (BTC) below $50,000 for the first time in nearly six months, Solana (SOL) witnessed a tumultuous period, recording a 40% decline over the past eight days.
The last time Solana faced a similar daily losing streak was in March 2023, leading to a collapse to $16. However, following the latest downturn, recent market activities indicate that Solana has set itself on a path to recovery.
Solana retests $140
The daily chart shows Solana recovering the $140 mark earlier this morning before skyrocketing to $144. This recovery suggests a strong bullish sentiment, but has faced mild corrections. Solana is up 7% in the past 24 hours and is trading at $140 at the time of writing.

Market analyst Kaleo confirmed Solana’s strength against Bitcoin despite the firstborn crypto engineering the recent rebound. The SOL/BTC ratio shows that Solana outperforms Bitcoin in the current recovery phase.
Kaleo notes that Solana’s strength against Bitcoin is impressive, with the SOL/BTC ratio poised for new highs. He suggests that a ratio of 0.01 is a strong target.
Also, the daily Accumulation/Distribution metric on the daily SOL chart shows a rising trend. This indicates that more investors are accumulating Solana, a positive sign for potential upward momentum, with the metric currently flashing a 297.43 million SOL figure.
Bearish momentum remains prevalent
Meanwhile, the Directional Movement Index (DMI) presents a mixed outlook. The positive directional indicator (+DI) has dropped to 15.08, indicating a slump in buying pressure. In contrast, the negative directional indicator (-DI) has increased to 35.83, confirming that the bears have maintained the selling pressure.
Notably, the Average Directional Index (ADX), which measures the strength of the trend, stands at 28. A high ADX above 25 suggests a strong trend, meaning that the bearish pressure has continued to outpace the recent bullish momentum.
Trader JohnnyB believes Solana’s downturn might not be over yet. He anticipates another drop before a full recovery. He views this potential drop as a “generational buy opportunity,” implying that the upcoming dip could present a favorable entry point for long-term investors.
Looking ahead, Solana’s current position confirms that its short-term future warrants cautious optimism. The accumulation phase indicated by the A/D metric suggests that investors are confident in Solana’s recovery.
However, the positions of the DMI indicators show that the bullish momentum has not yet engulfed the selling pressure.
Solana has already recovered the $132.68 level, flipping it from resistance to support. If the bullish momentum gains steam, the bulls could mount a rebound toward the 20-day SMA at $167.07. However, a weakening bullish push might revisit the $132 support, which, if breached, could bring the $124.85 defense into the picture.
This article first appeared at crypto.news

