Ripple’s price has been consolidating in a specific range over the past few months despite the substantial volatility experienced in the past few days.
However, as things stand, it could only be a matter of time for another big move to taka place.
By Edris Derakhshi (TradingRage)
The USDT Paired Chart
On the daily chart of the XRP/USDT pair, the price has been moving sideways over the recent months after failing to continue above the $3 resistance level.
Currently, it seems likely that the market will drop lower toward the 200-day moving average, which is located around the $1.5 mark, before continuing higher. Yet, if the $2 level holds and prevents such a deep correction, a much quicker move toward the $3 level and even higher could be expected.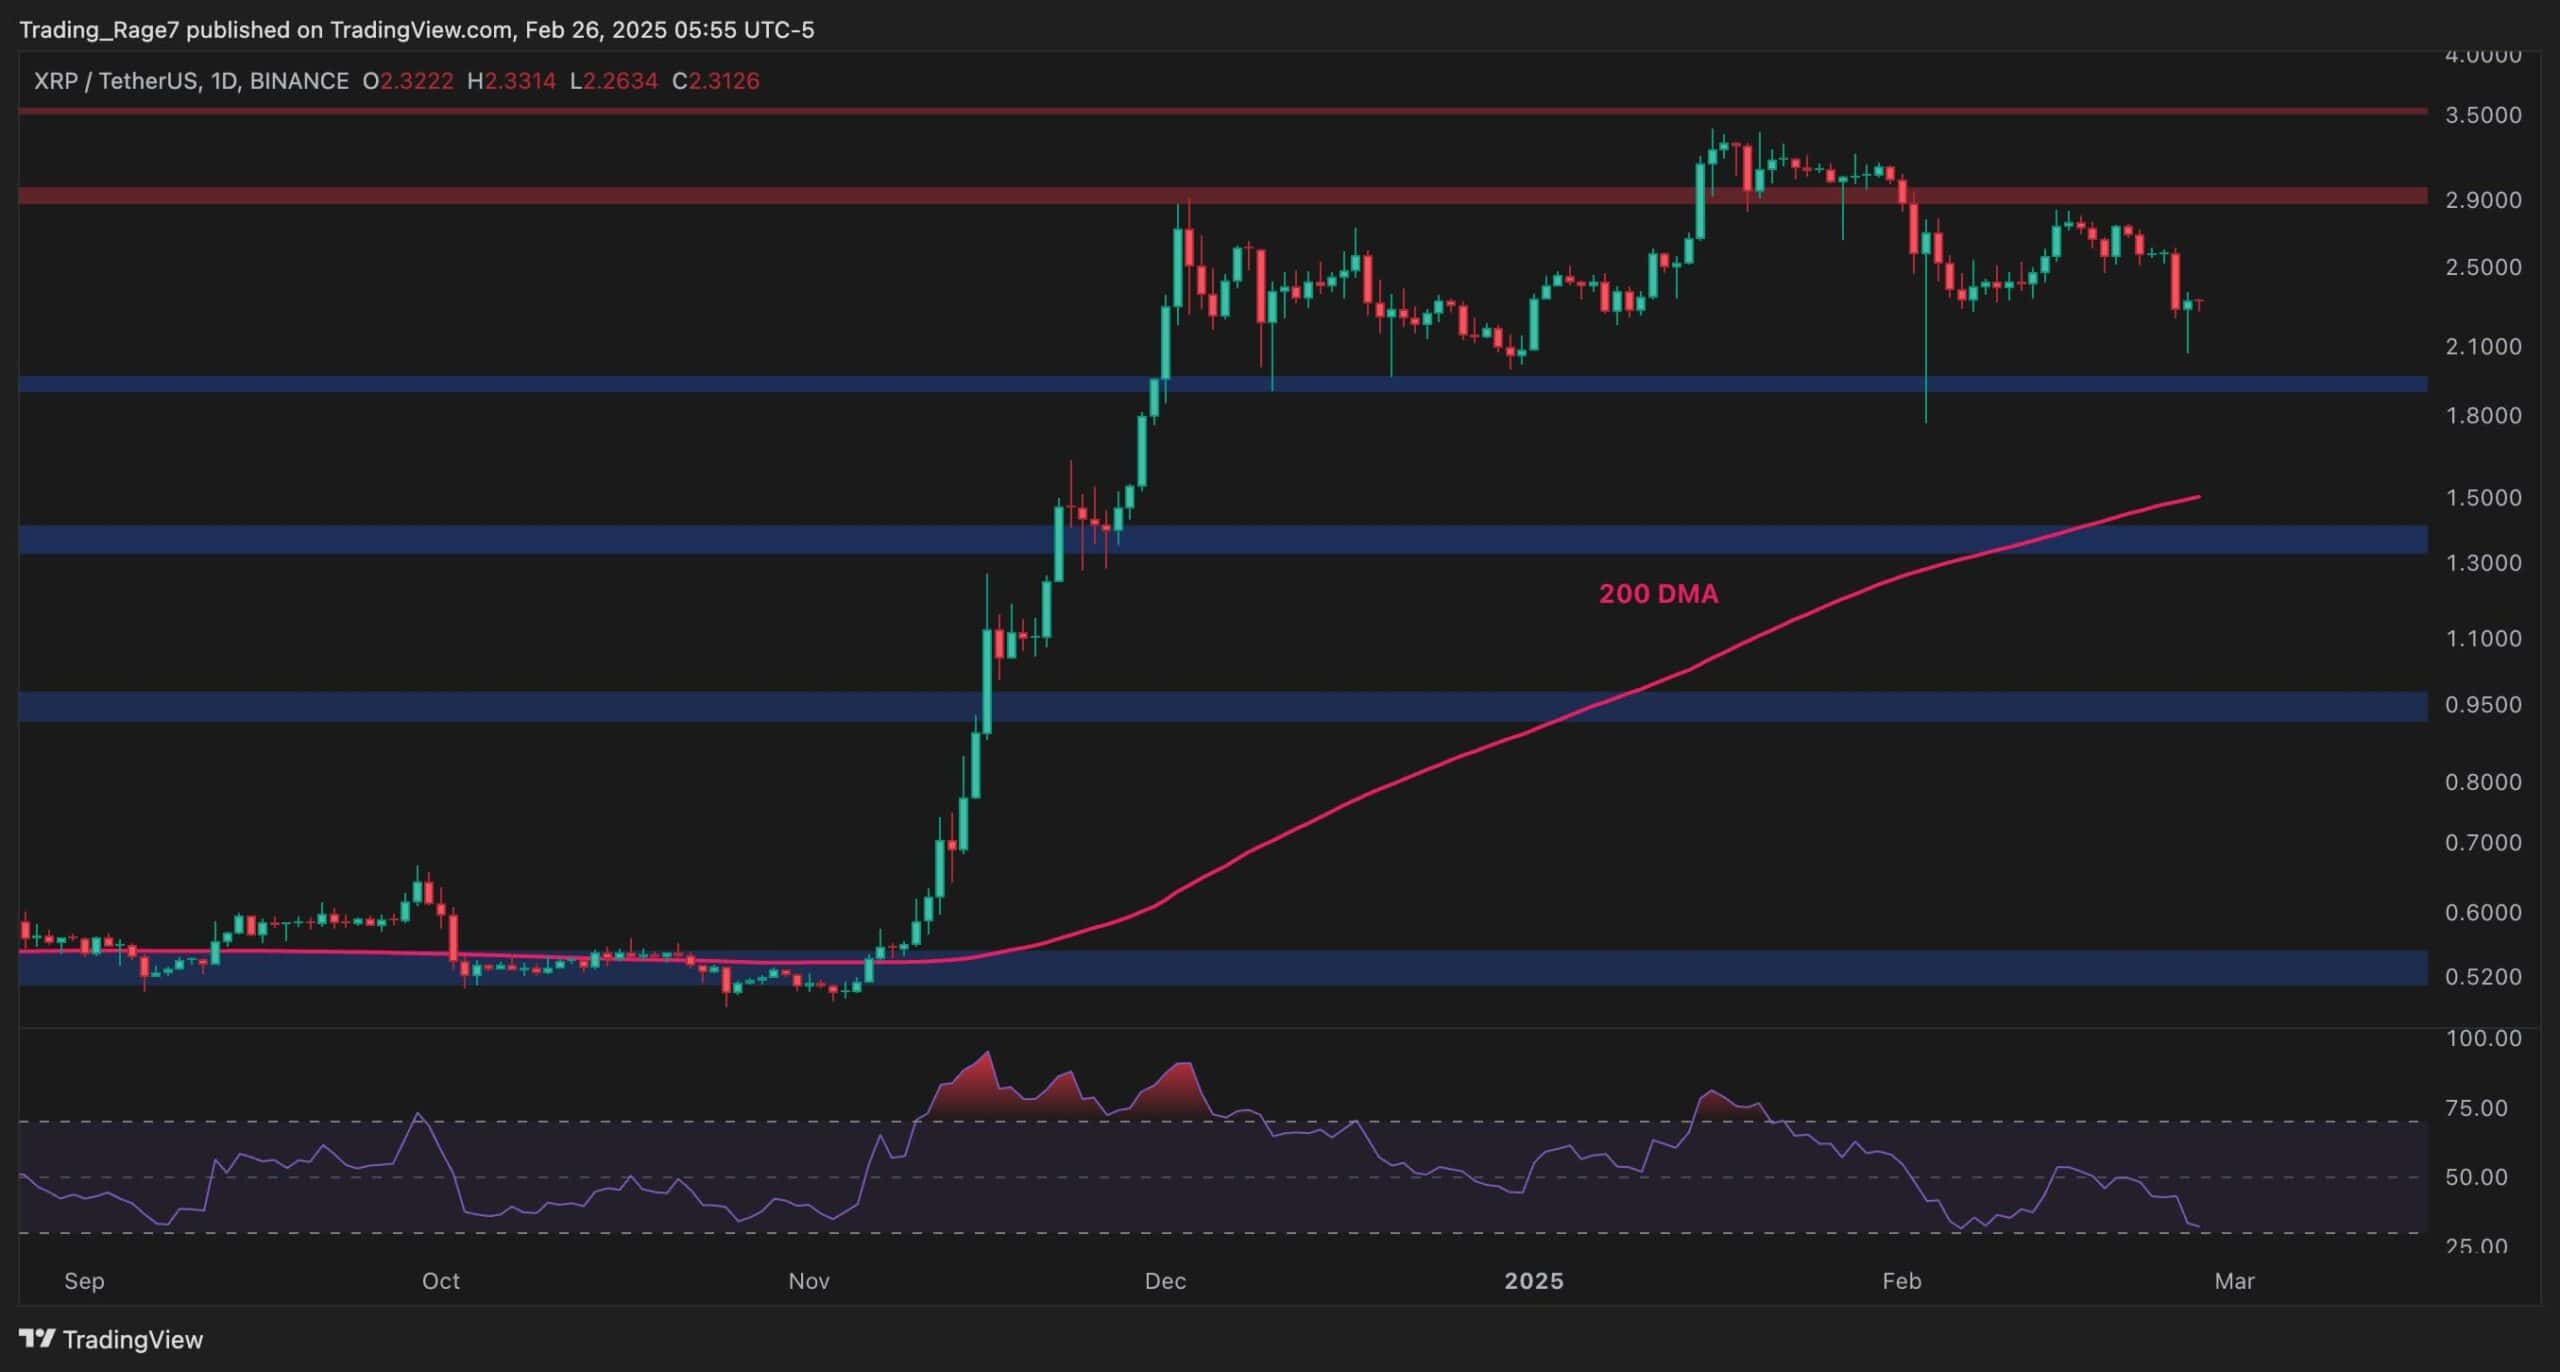
The BTC Paired Chart
The XRP/BTC pair’s chart shows almost a similar picture in terms of the daily timeframe, as the passet rice has been consolidating since December last year.
Meanwhile, the price action seems more bullish for Ripple against Bitcoin, as it has not created a definitive lower low yet, and could still climb higher above the 3,000 SAT mark and even toward the 4,000 SAT level in the coming weeks.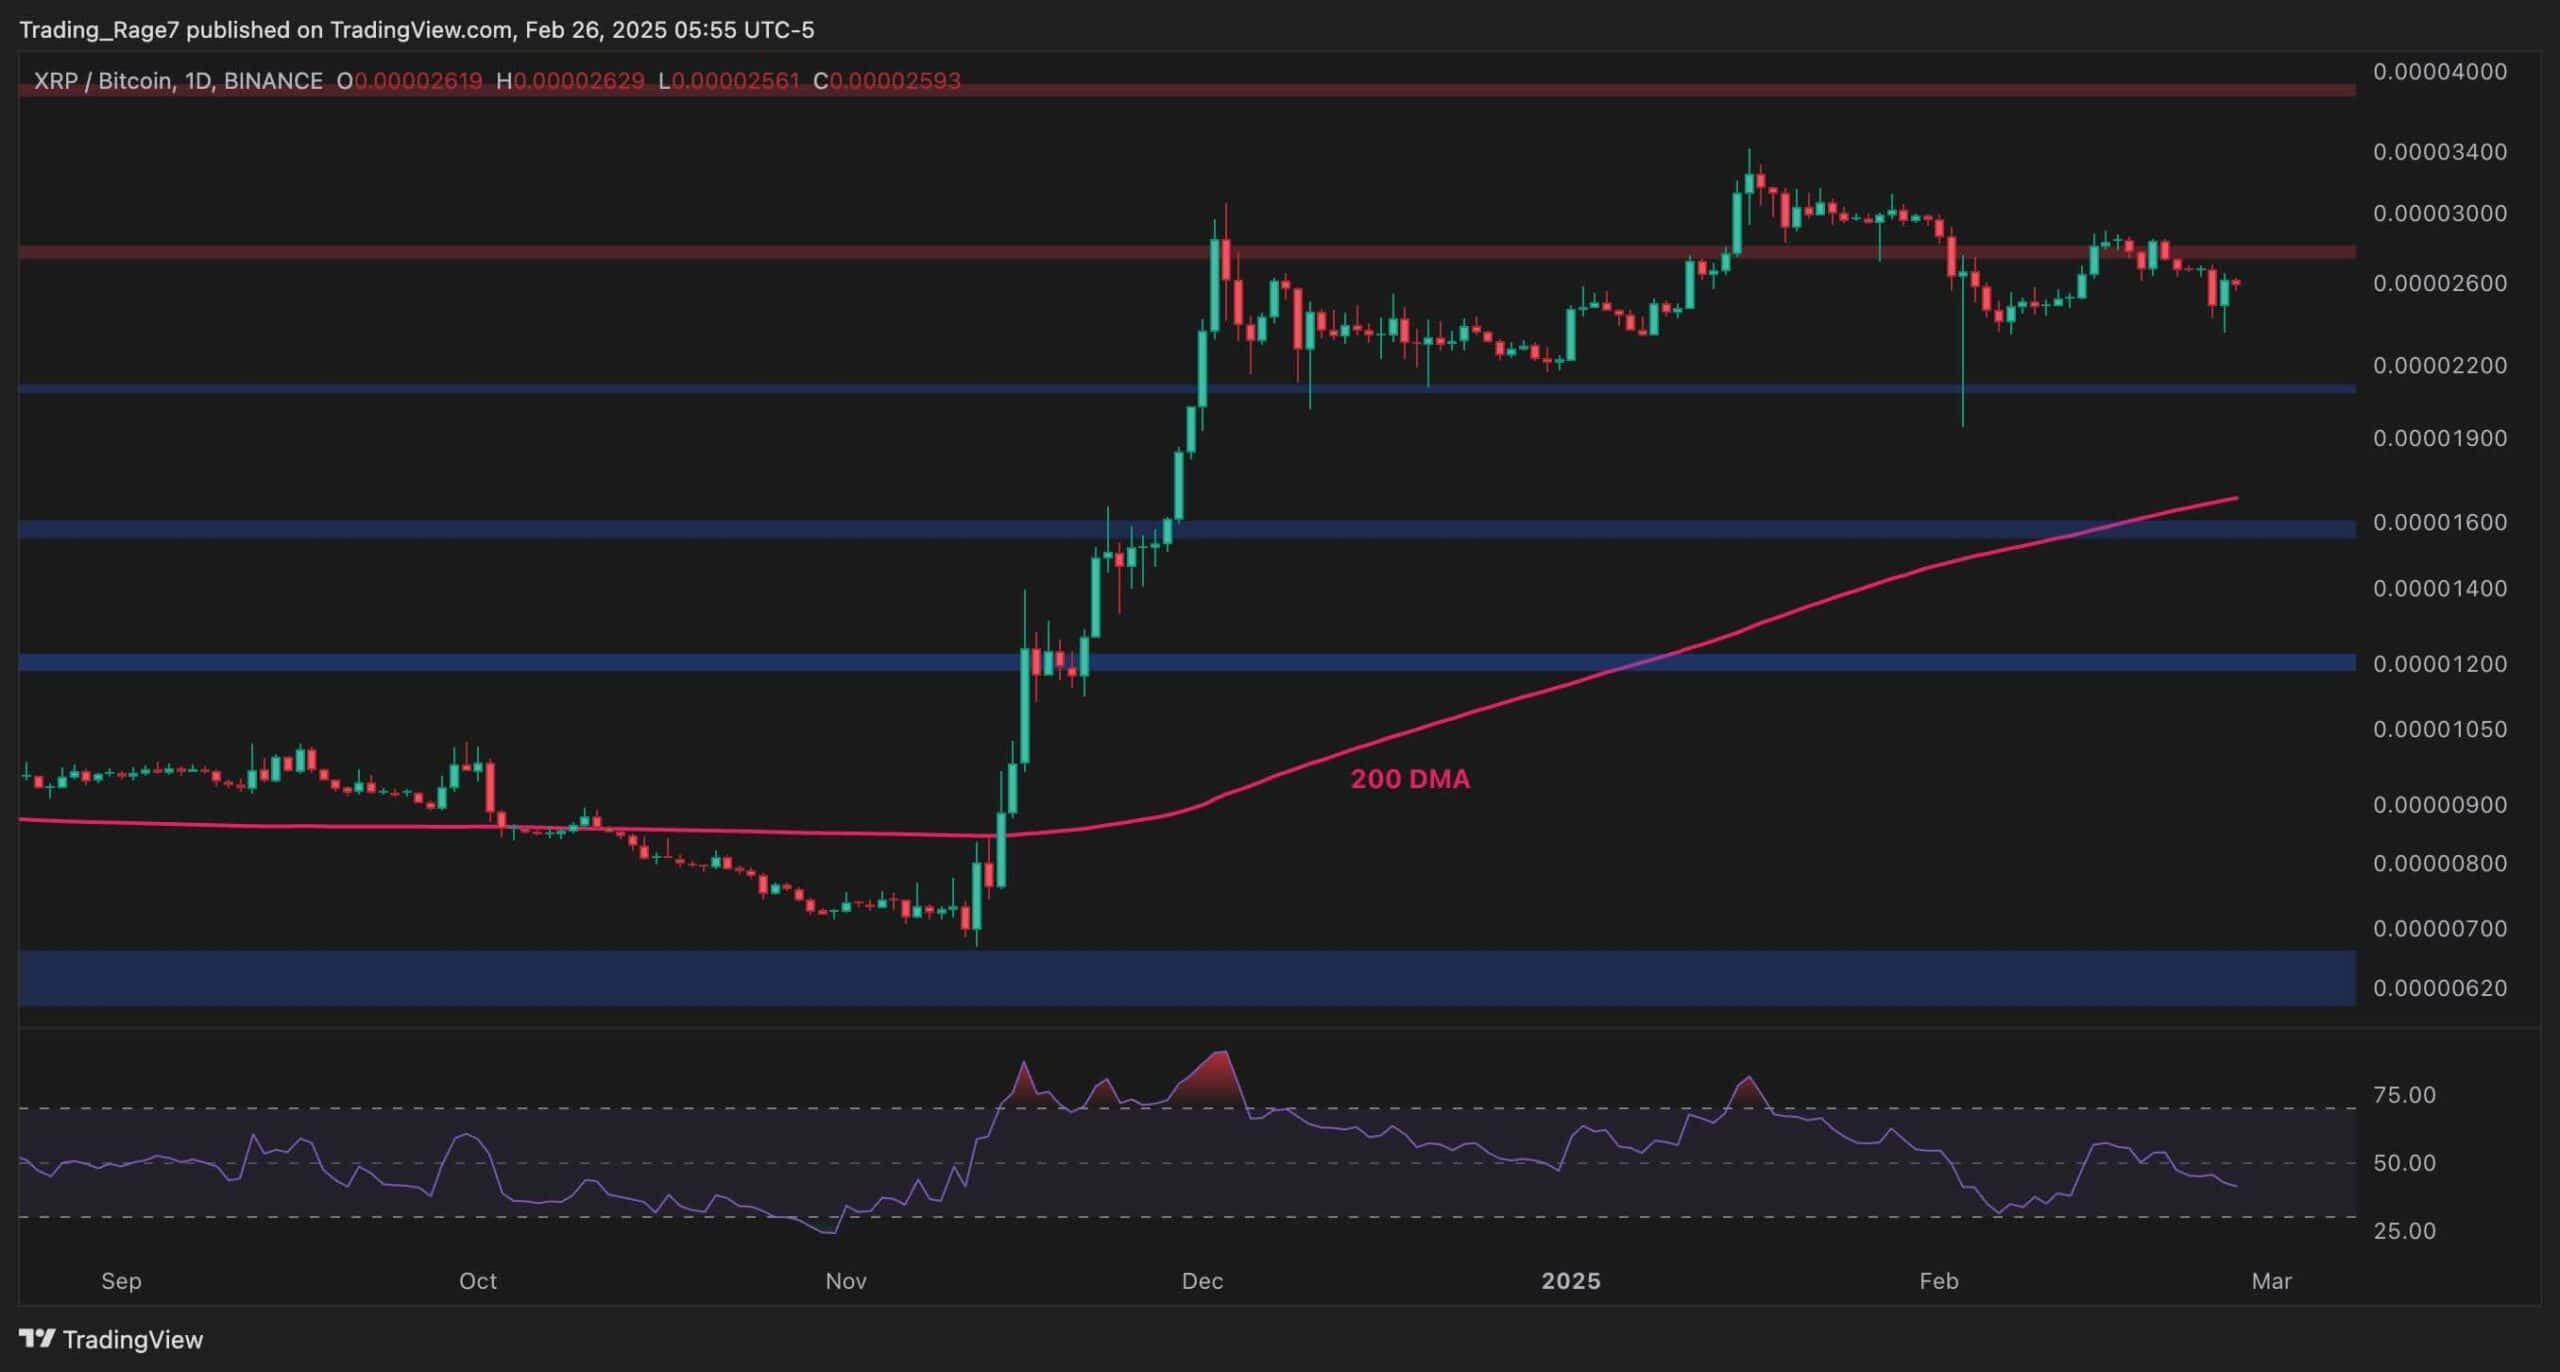
This article first appeared at CryptoPotato

