Ripple’s price has been bearish over the last few weeks as it failed to continue its upward momentum. Looking at the technical charts, more downsides are probable in the short term.
Ripple Price Analysis: Technicals
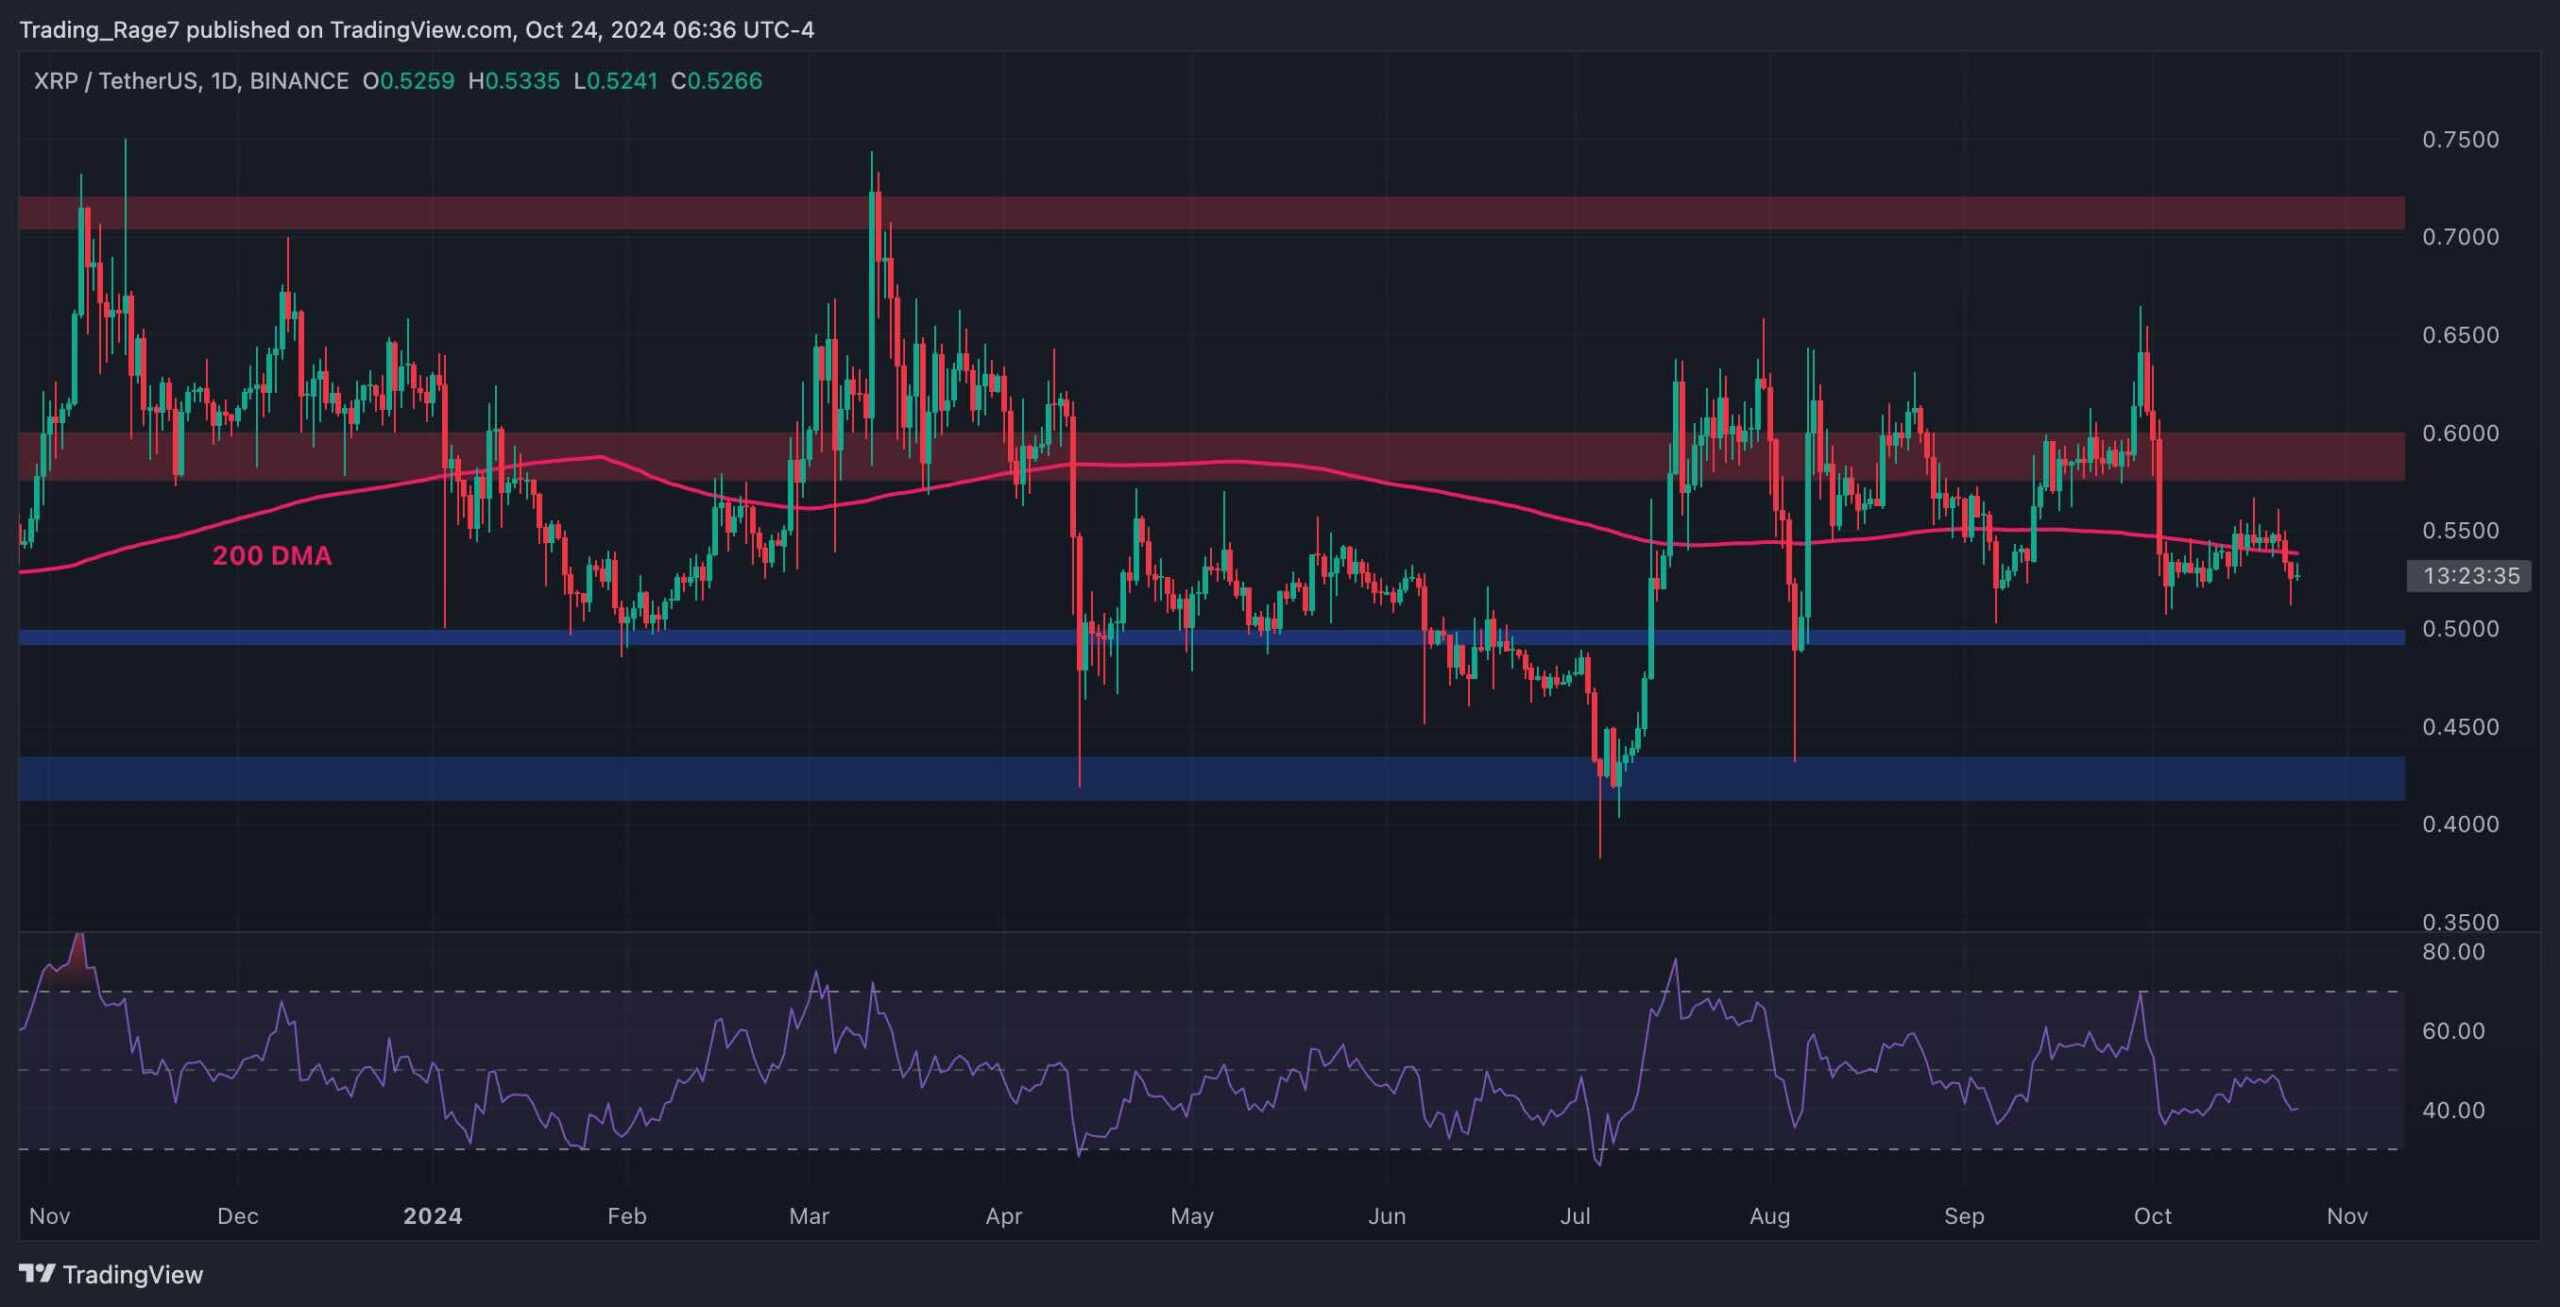
The USDT Paired Chart
By Edris Derakhshi (TradingRage)
Against USDT, the XRP price has recently crashed below the $0.6 level and the 200-day moving average, which is located around the $0.55 mark.
With the RSI also showing values below 50%, the momentum is clearly bearish. The market is likely to drop toward the $0.5 support level in the upcoming days and even lower toward the $0.43 support zone if the $0.5 level is broken.
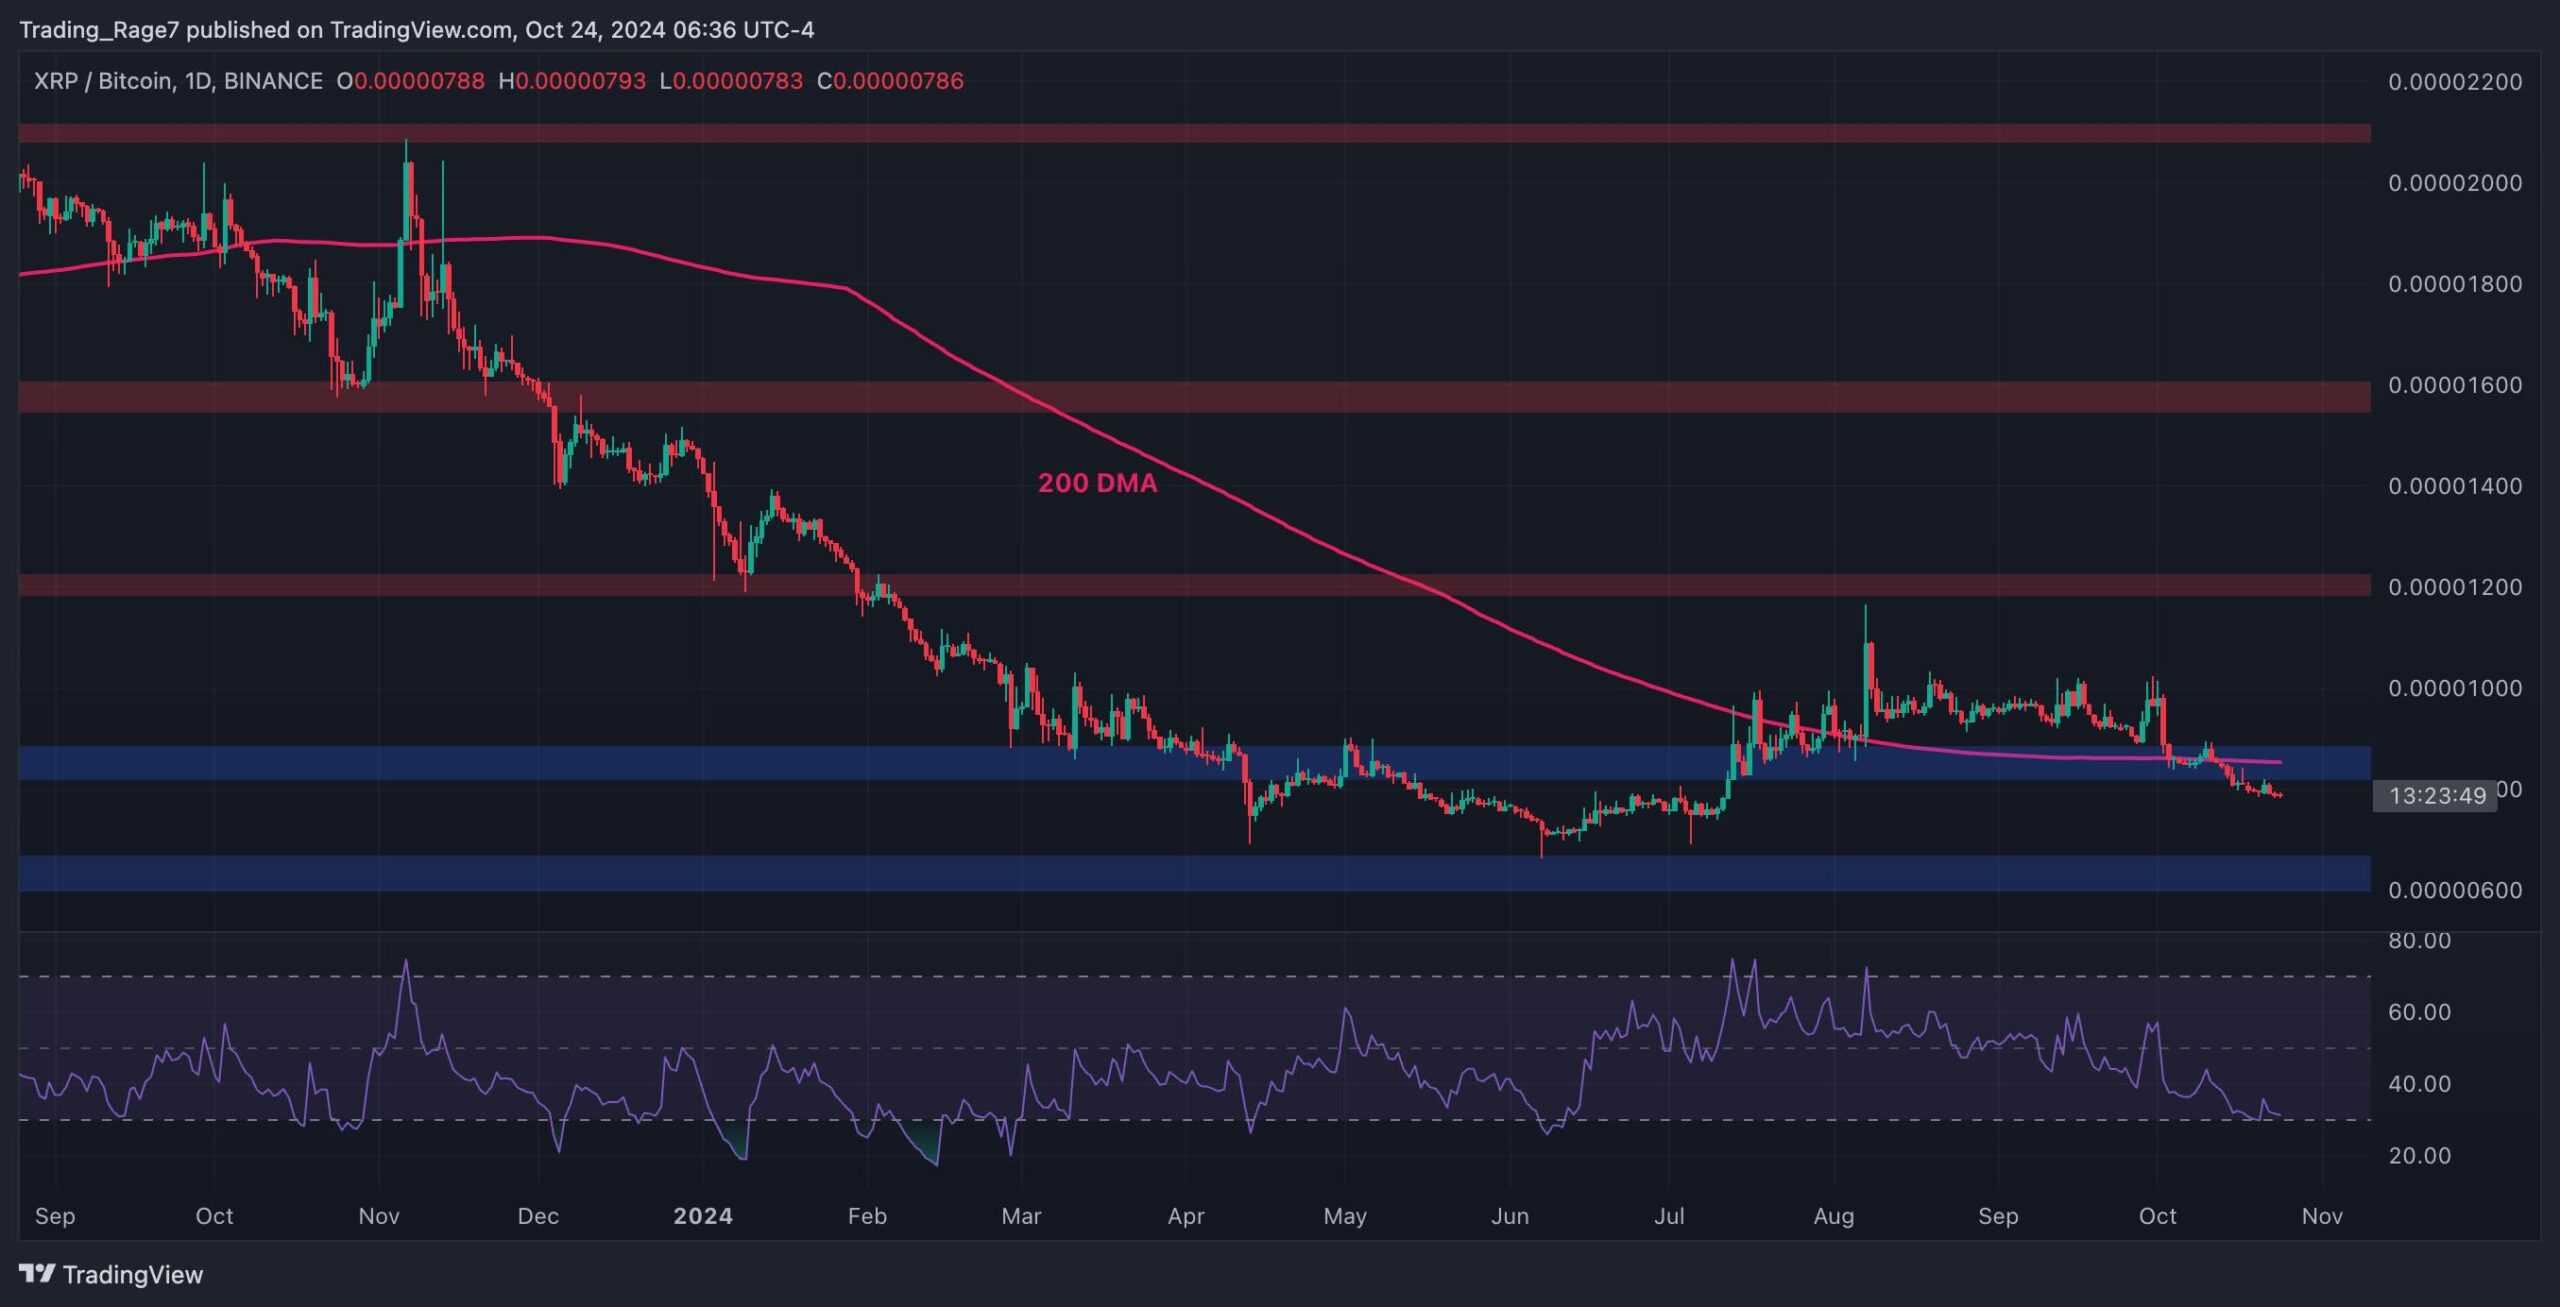
The BTC Paired Chart
The XRP/BTC chart shows a similar behavior, as the price has dropped below the 850 SAT support level and the 200-day moving average, located around the same price mark.
Therefore, a further decline toward the 600 SAT area could be expected if the market does not climb above the 200-day moving average soon.
Meanwhile, the RSI is reaching the oversold regions, which could point to a potential bullish reversal or consolidation in the short term.
This article first appeared at CryptoPotato