Ripple’s price has been on a massive uptrend over recent weeks, even with the flash crash it experienced a couple of weeks ago.
Yet, for a further bullish continuation to materialize, a specific resistance range needs to be overcome.
By Edris Derakhshi (TradingRage)
The USDT Paired Chart
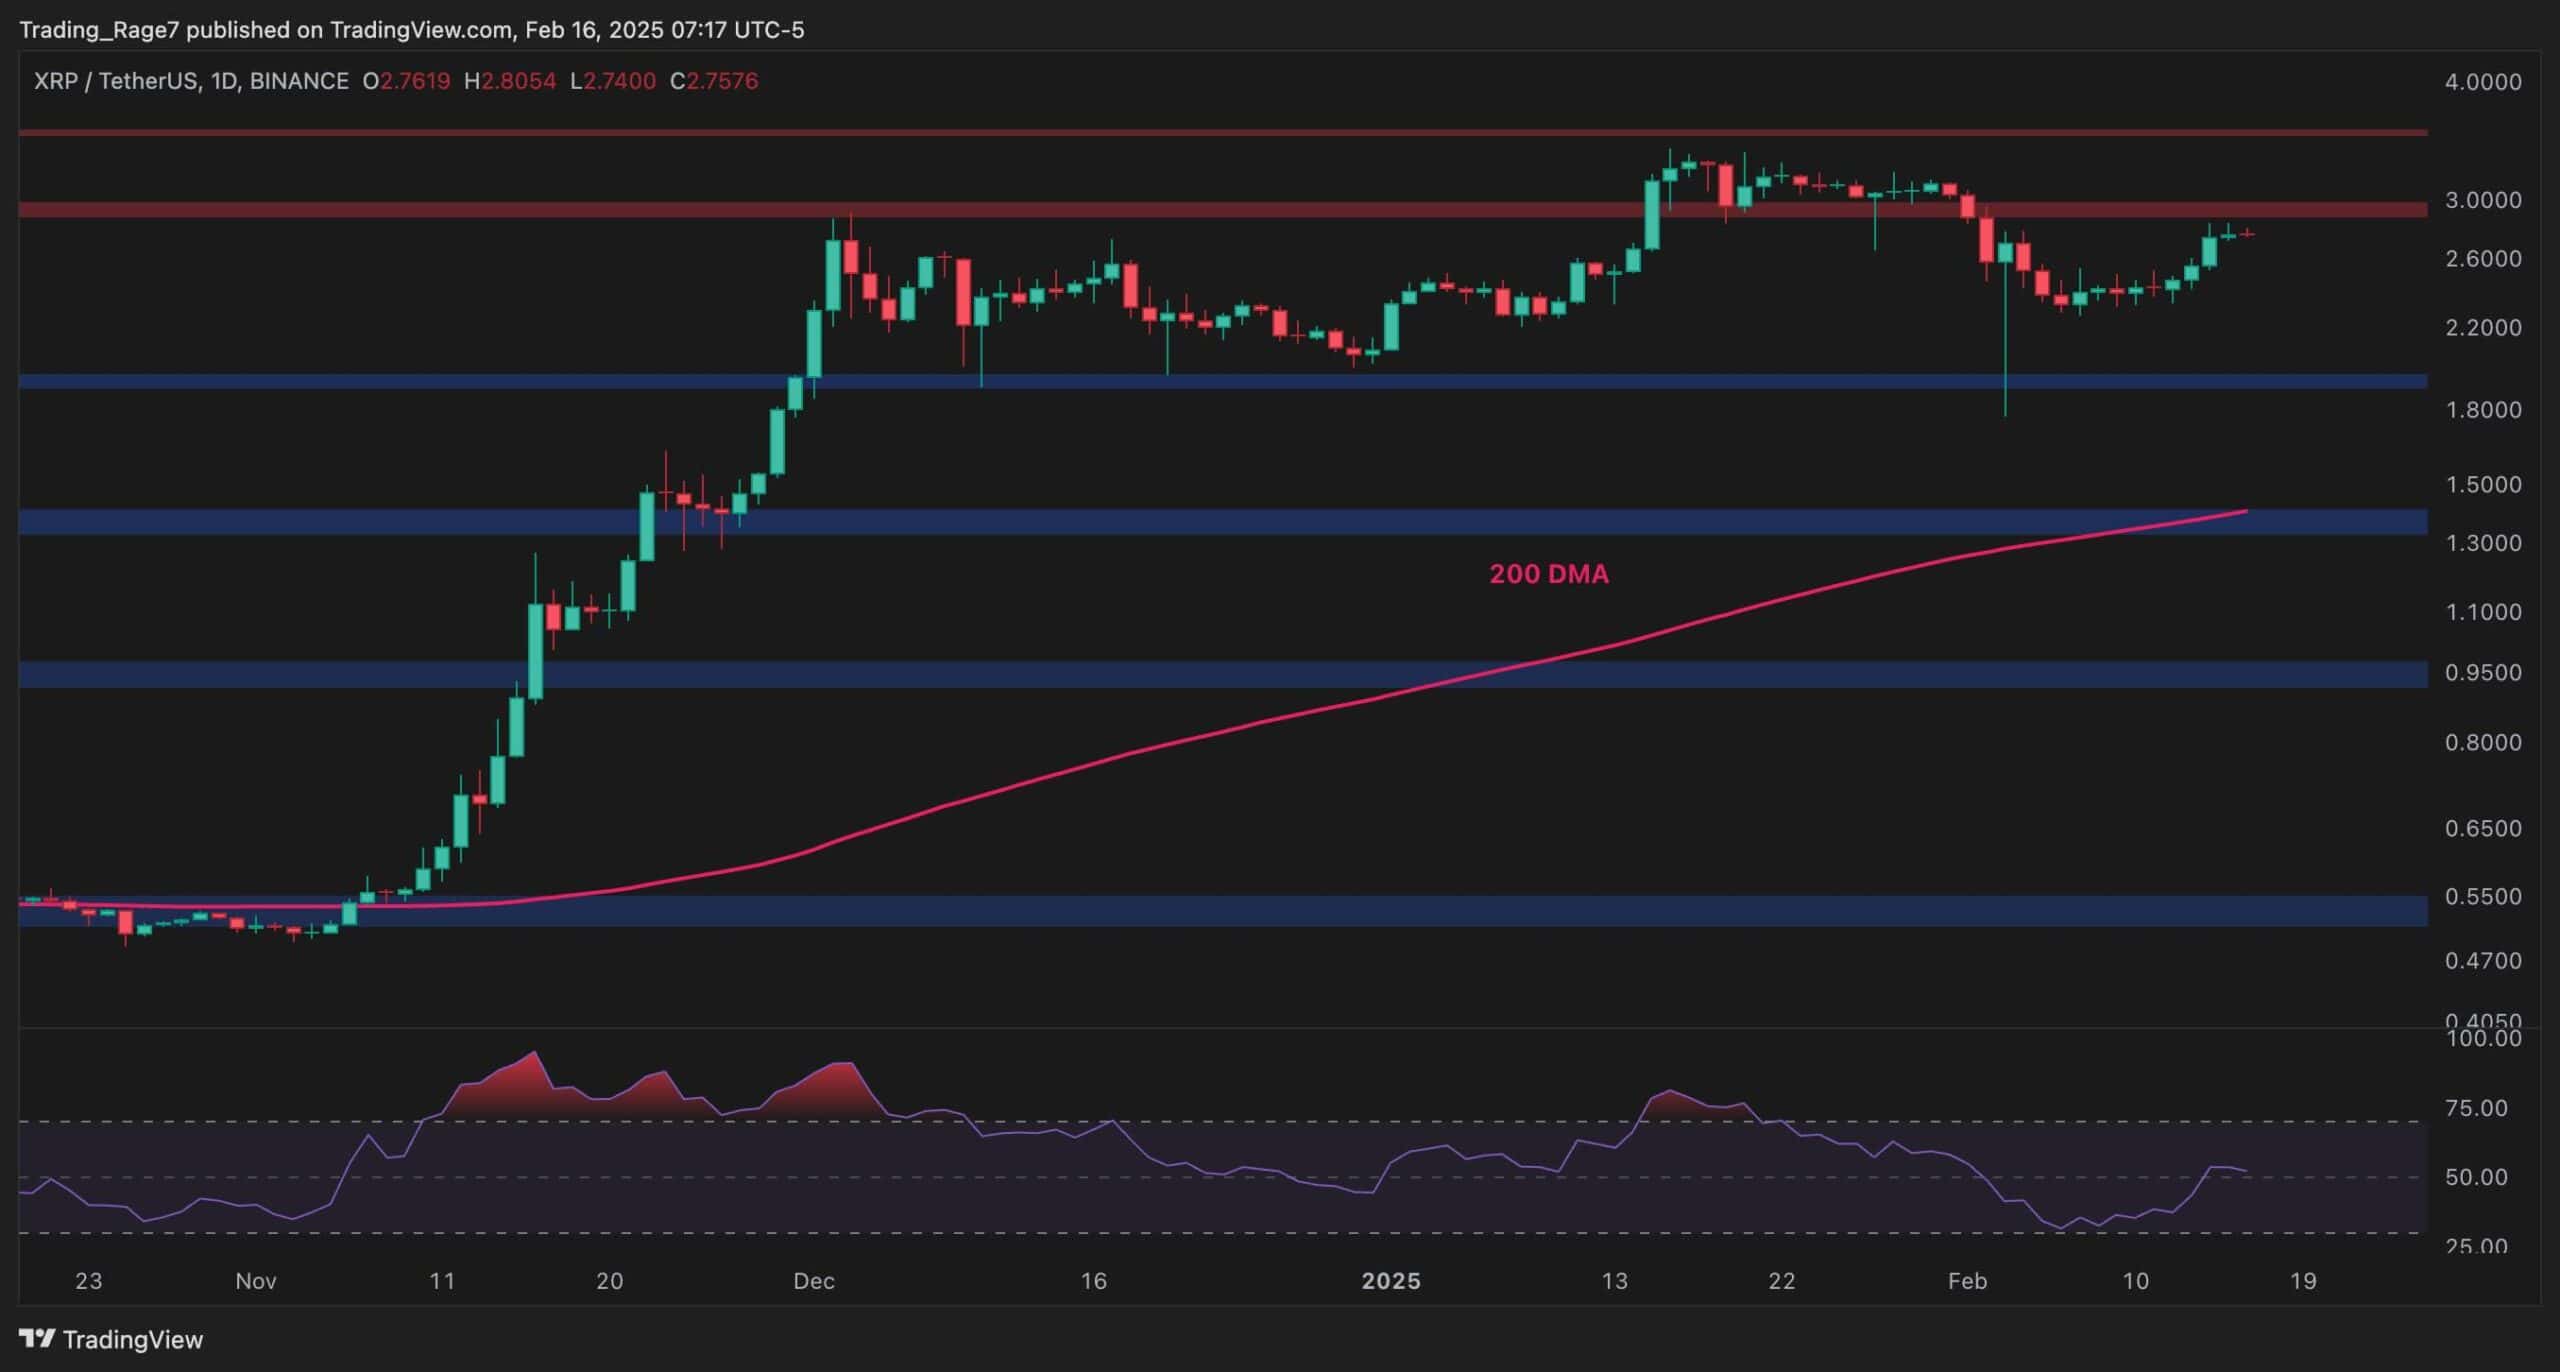
Against USDT, the cryptocurrency has recently gone through a quick drop toward the $2 support level but has been able to rebound quickly. Currently, the price is bound to test the $3 resistance zone, and in case of a breakout, a rally toward $4 could be expected in the coming weeks.
On the other hand, a rejection could see the market fall back to the $2 area and even lower.
The BTC Paired Chart
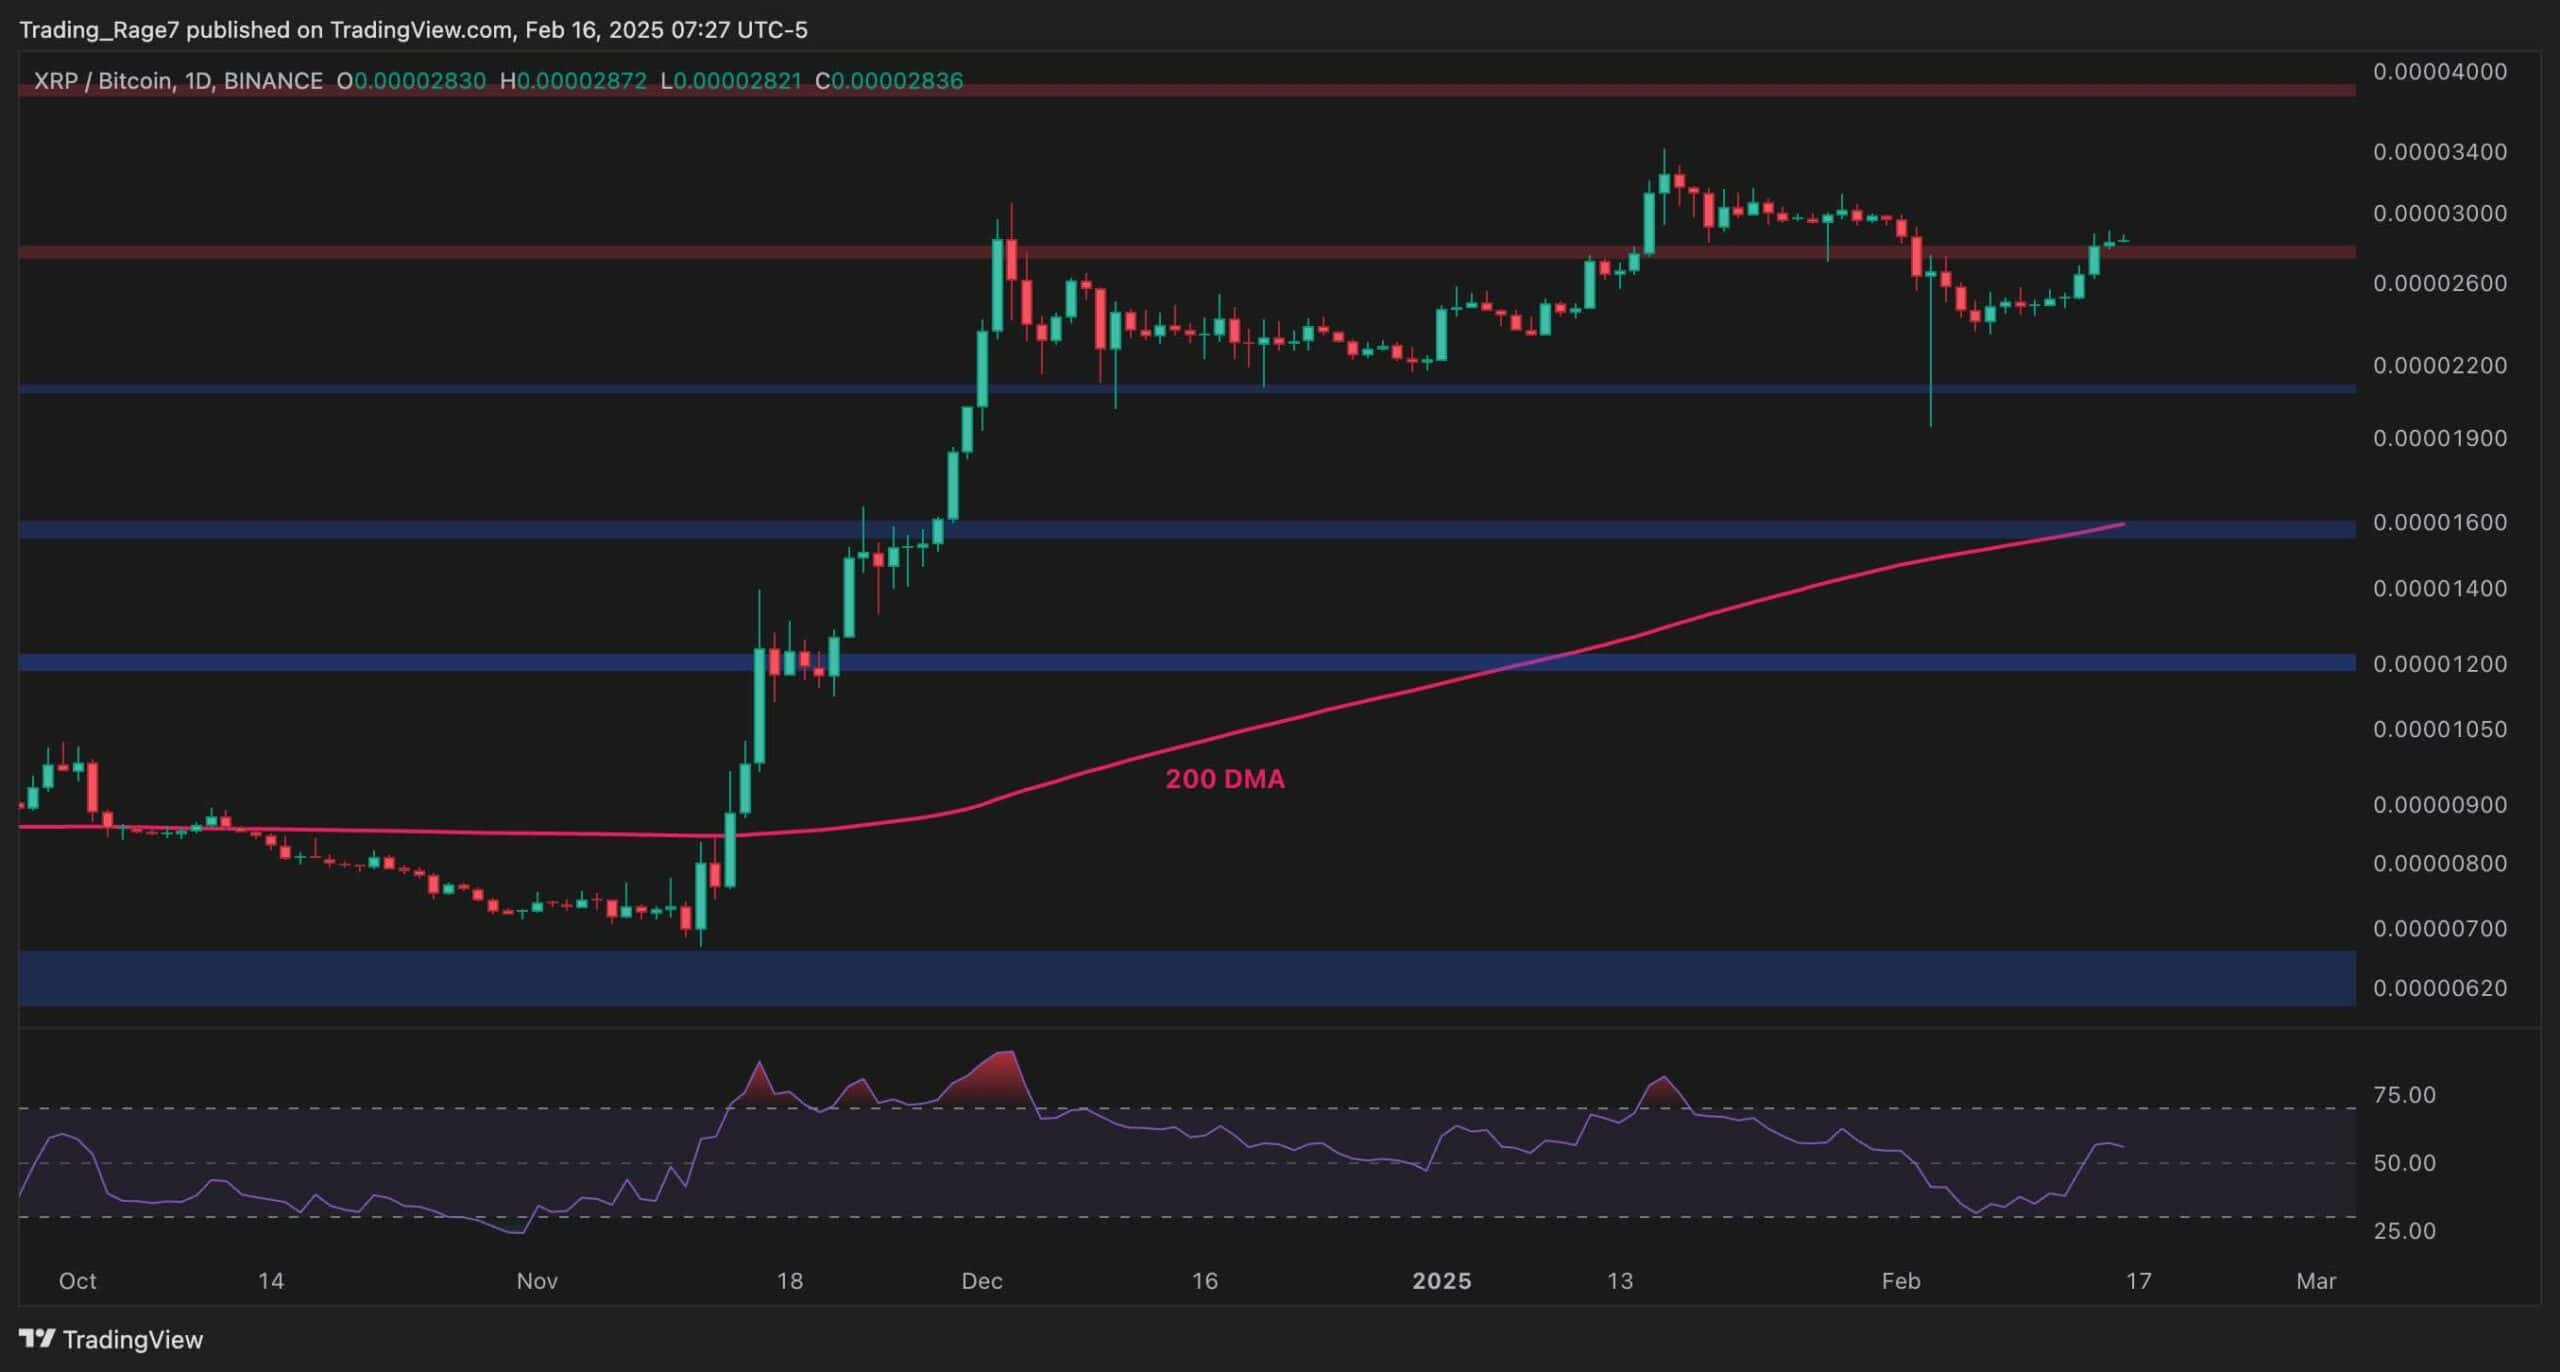
The XRP/BTC pair’s daily chart shows a more optimistic picture, as the market is about to break the key resistance level of 2,800 SAT to the upside.
The RSI is also showing values above 50%, indicating that the momentum is in favor of a bullish move. A breakout above the 2800 SAT zone would likely lead to a price surge toward the 4,000 SAT area, which could be seen as a massive move for XRP.
This article first appeared at CryptoPotato
