Ethereum price has stalled this month as cryptocurrency investors remain on the sidelines, but some fundamental and technical catalysts may push it higher.
Ethereum (ETH), the second-biggest cryptocurrency, was trading at $2,700 on Tuesday, a 35% drop from its highest level in November. This price is notable since it coincides with where it was trading on the same date in 2024.
A few catalysts may help to push Ethereum price higher in the coming months. First, data shows that spot Ethereum ETFs have continued having inflows from Wall Street investors. They have had daily inflows in 7 out of 10 days this month, with their total inflows since inception rising to $3.15 billion.
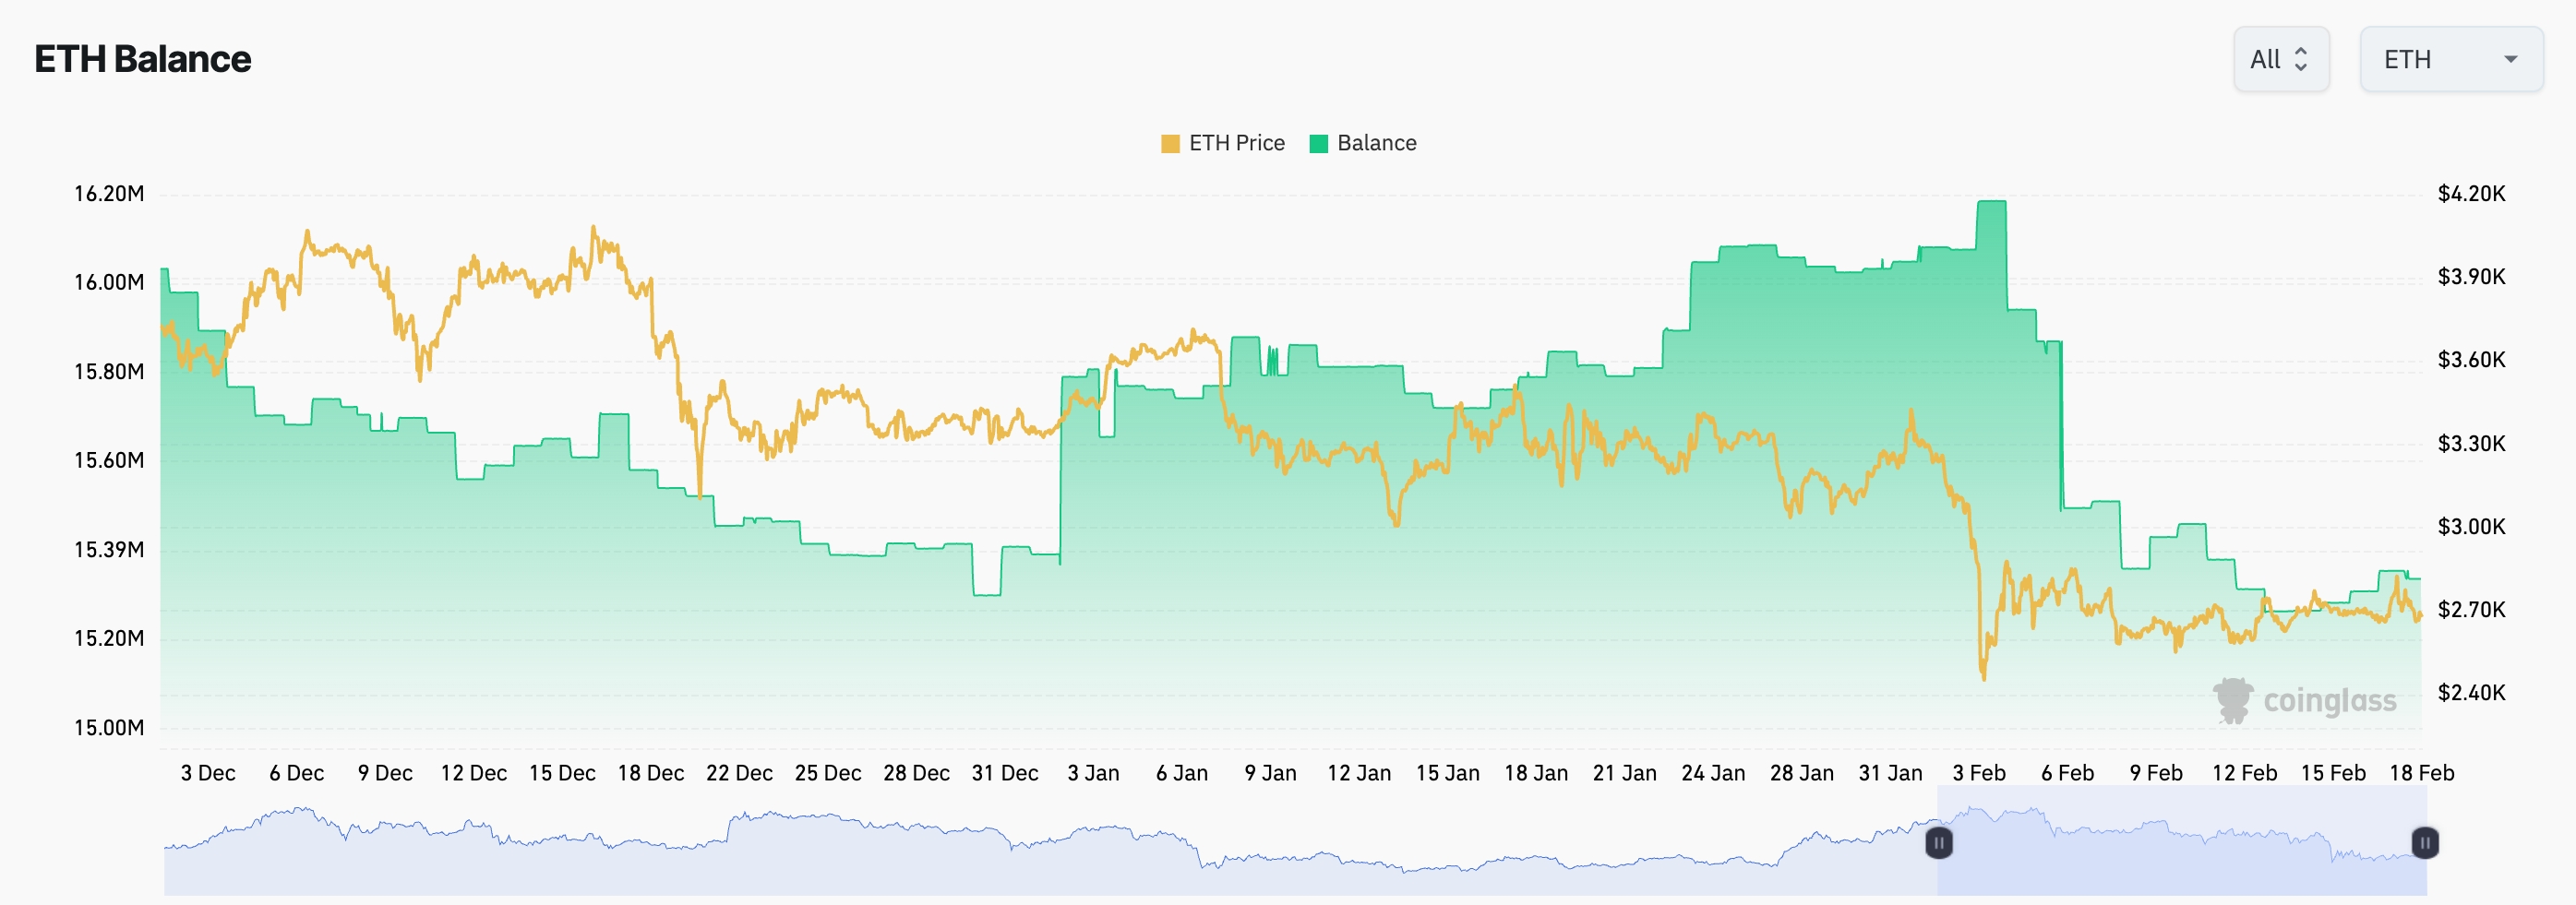
Second, CoinGlass data shows that Ethereum balances in centralized exchanges have plunged in the past few days. There are now 15.34 million coins, down from this month’s high of 16.2 million. Falling balances are a sign that many ETH holders are not selling and are instead holding them in self-custody.

Third, there are signs that Ethereum network is catching up with Solana (SOL) in terms of decentralized exchange transactions. Protocols on Ethereum handled over $2.28 billion in the last 24 hours compared to Solana, which has been criticized after numerous meme coin rug pulls. The most recent one was Libra, which surged and crashed last weekend.
Ethereum price has strong technicals

Short-term charts show that Ethereum price may have a strong bearish breakdown after forming a death cross pattern. This pattern forms when the 50-day and 200-day moving averages cross each other.
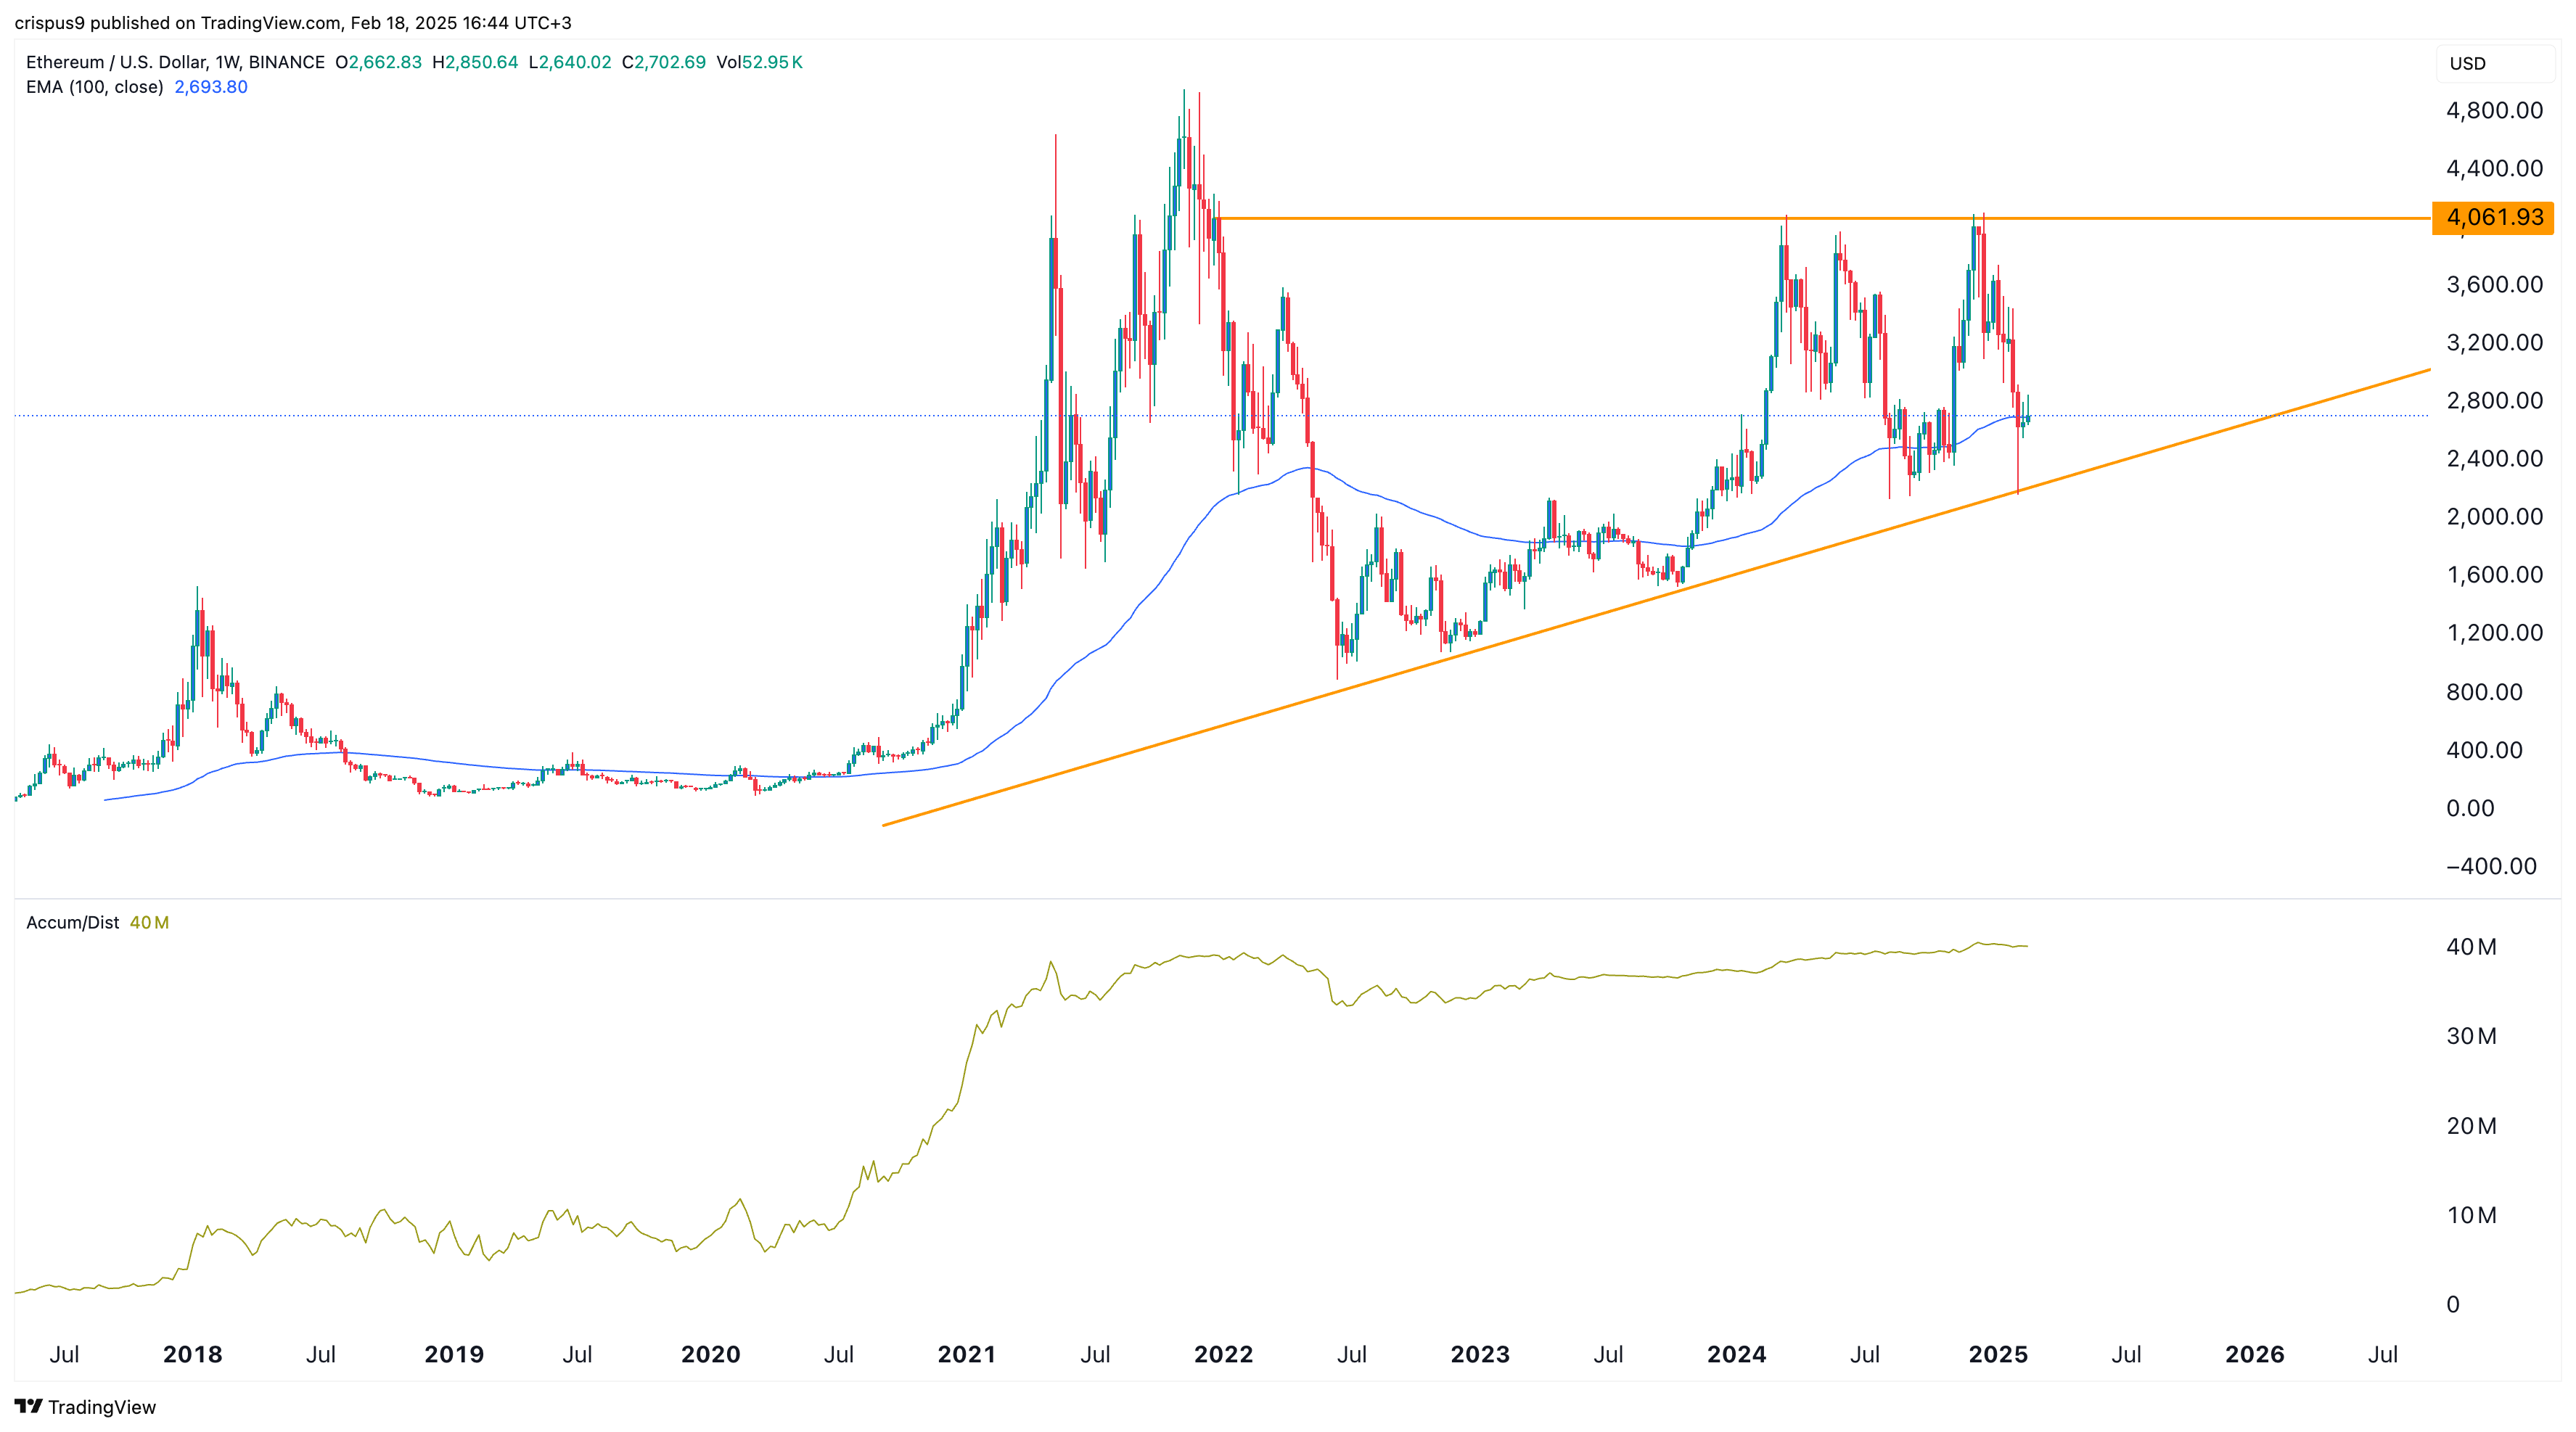
However, a closer look at longer-term charts points to a potential ETH price rebound. The weekly chart above shows that the accumulation and distribution indicator has continued rising, signalling that investors have continued to accumulate the token.
It also shows that it is forming an ascending triangle pattern, which is made up of two parts: an ascending trendline and a horizontal resistance. A bullish breakout happens when the two lines near their convergence. ETH has also formed a megaphone pattern, another bullish sign.
The challenge is that the bullish breakout may take time since it is on the weekly chart. Signals on a weekly chart may take months or over a year to complete.
A bullish breakout above the upper side of the triangle at $4,061 will point to more gains, possibly to the all-time high of $4,945 followed by $5,000.
Disclosure: This article does not represent investment advice. The content and materials featured on this page are for educational purposes only.
This article first appeared at crypto.news
