Following a rejection at the crucial 100-day moving average, Ethereum experienced an impulsive decline, reaching the crucial $2K support. Nevertheless, the price has bounced back and is going through a rather muted price action, indicating a potential consolidation stage.
By Shayan
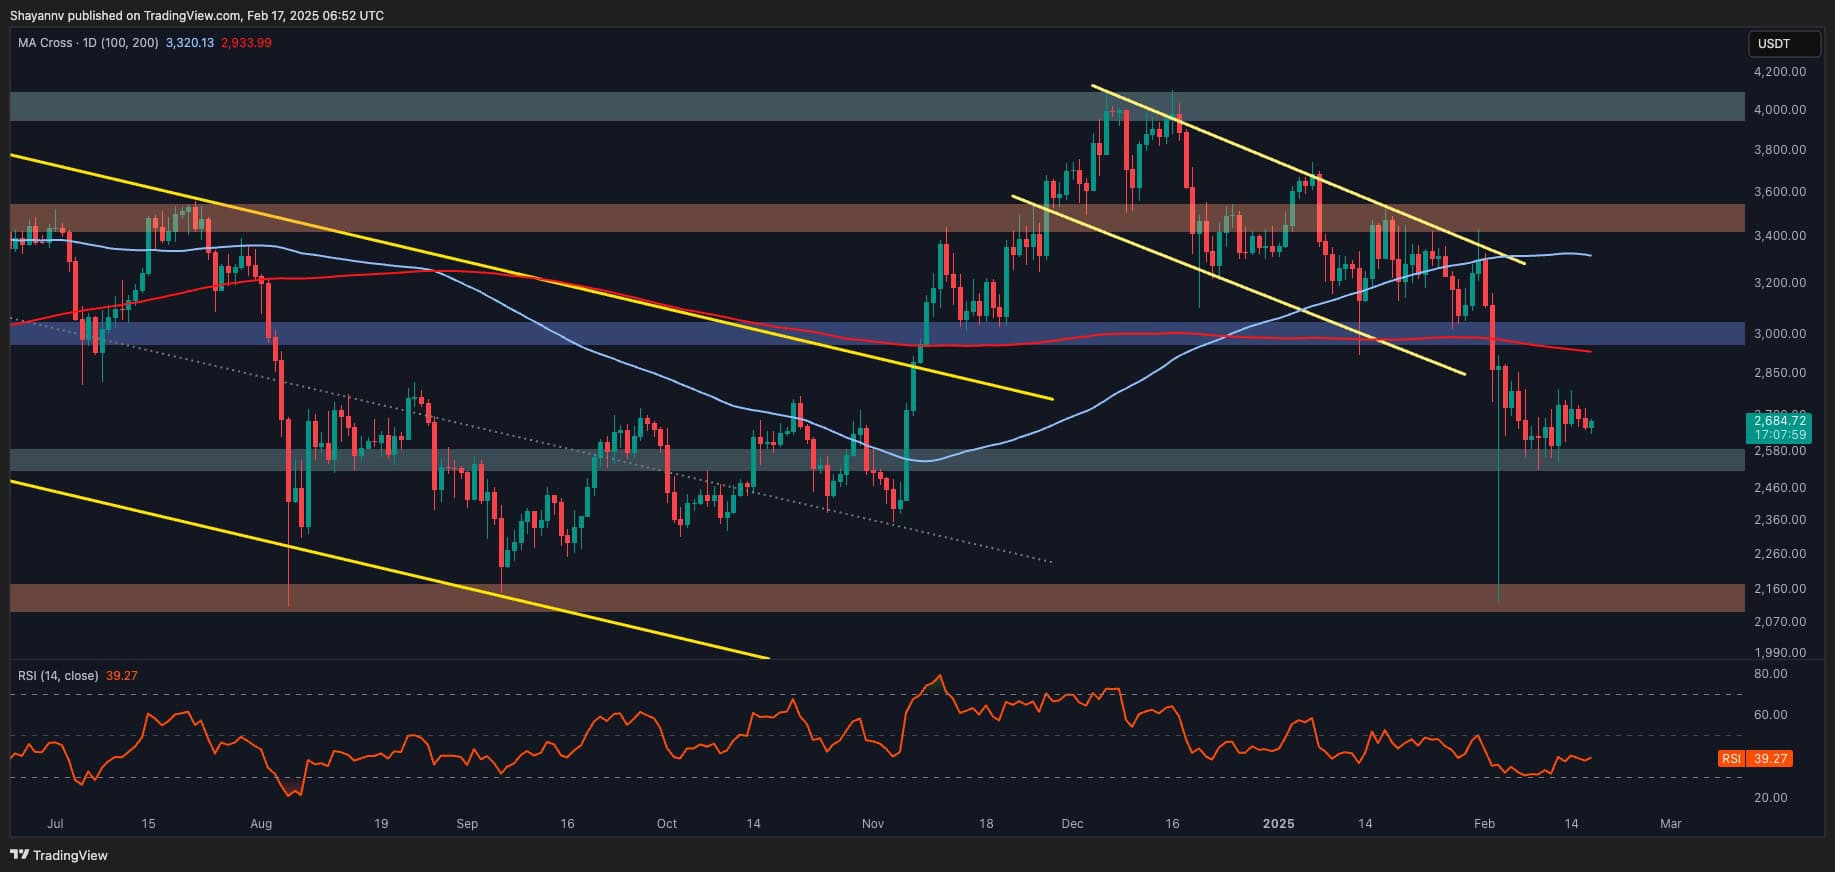
The Daily Chart
Ethereum faced heavy selling pressure at the 100-day moving average of $3K, leading to an impulsive decline toward the $2K psychological support. Despite this bearish move, the price quickly rebounded, clearing over-leveraged long positions in the futures market.
The cryptocurrency is now trading between $2.5K (support) and $3K (resistance), forming a decisive range.
A breakout from this range will provide clear confirmation of the next major trend. However, short-term consolidation remains the most probable scenario.
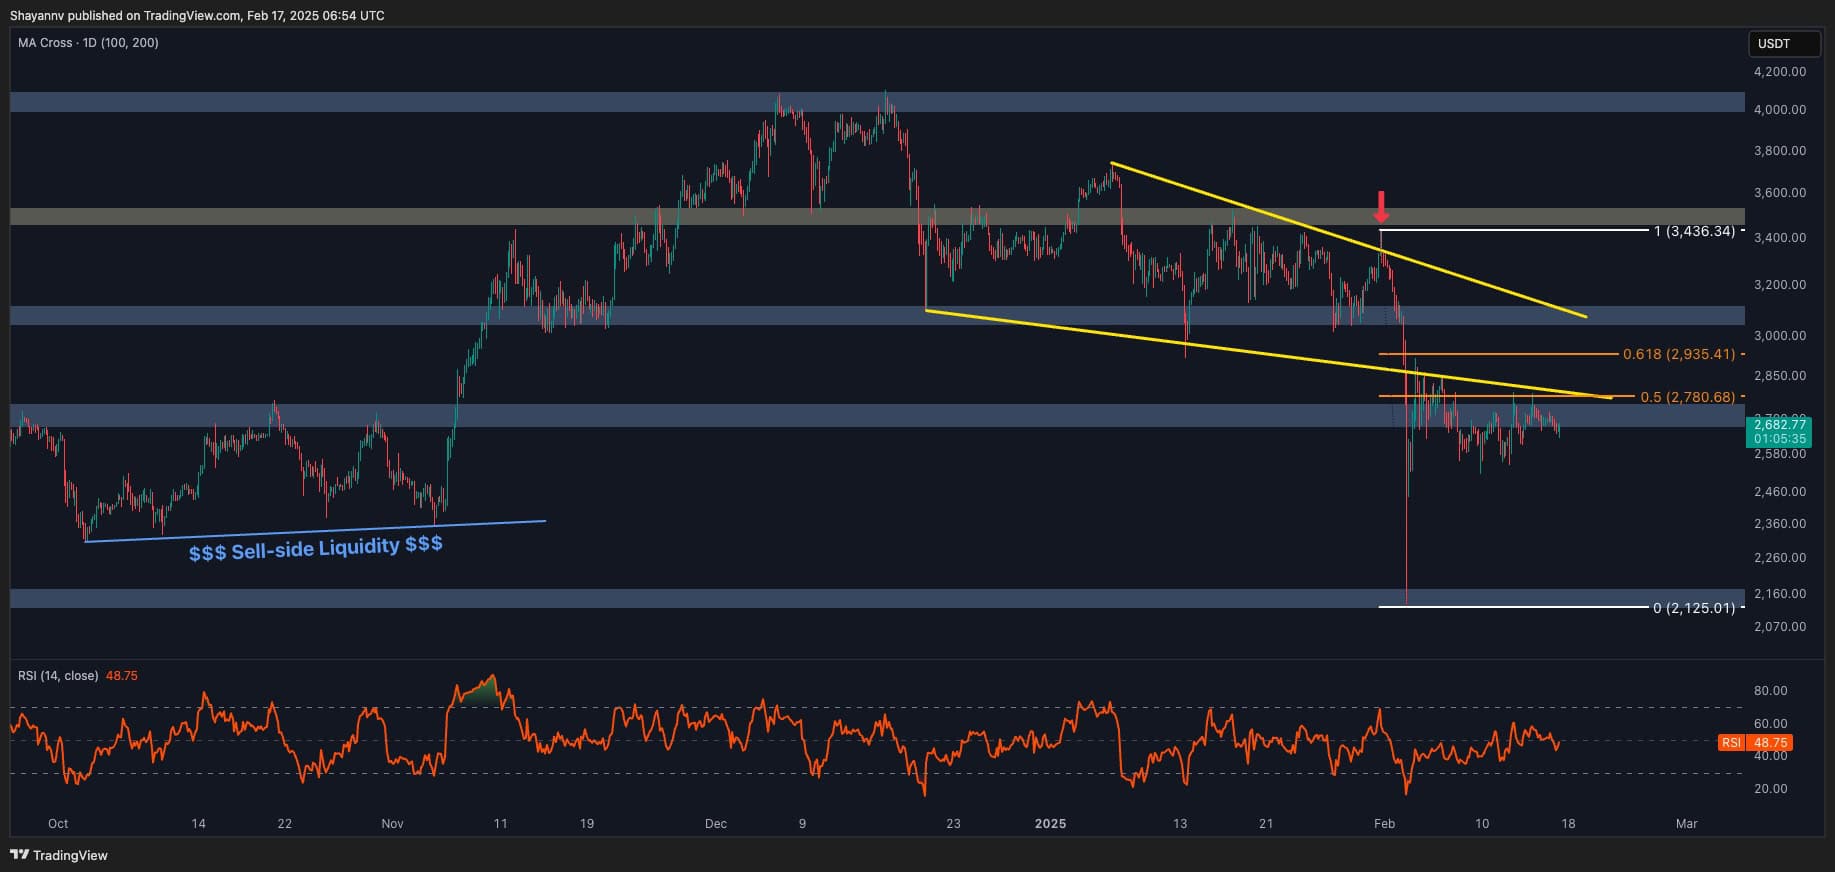
The 4-Hour Chart
On the lower timeframe, ETH initially broke above the descending wedge pattern, but the breakout proved false, leading to a sharp decline toward the $2.2K support range.
This move triggered the sell-side liquidity before the price rebounded strongly. Now, the cryptocurrency is facing a strong barrier at the 0.5-0.618 Fibonacci retracement zone and the $2.8K resistance level.
While a period of high volatility is expected in the near term, there is also a possibility that the sellers might regain control of this resistance zone, causing another rejection toward the $2K threshold.
By Shayan
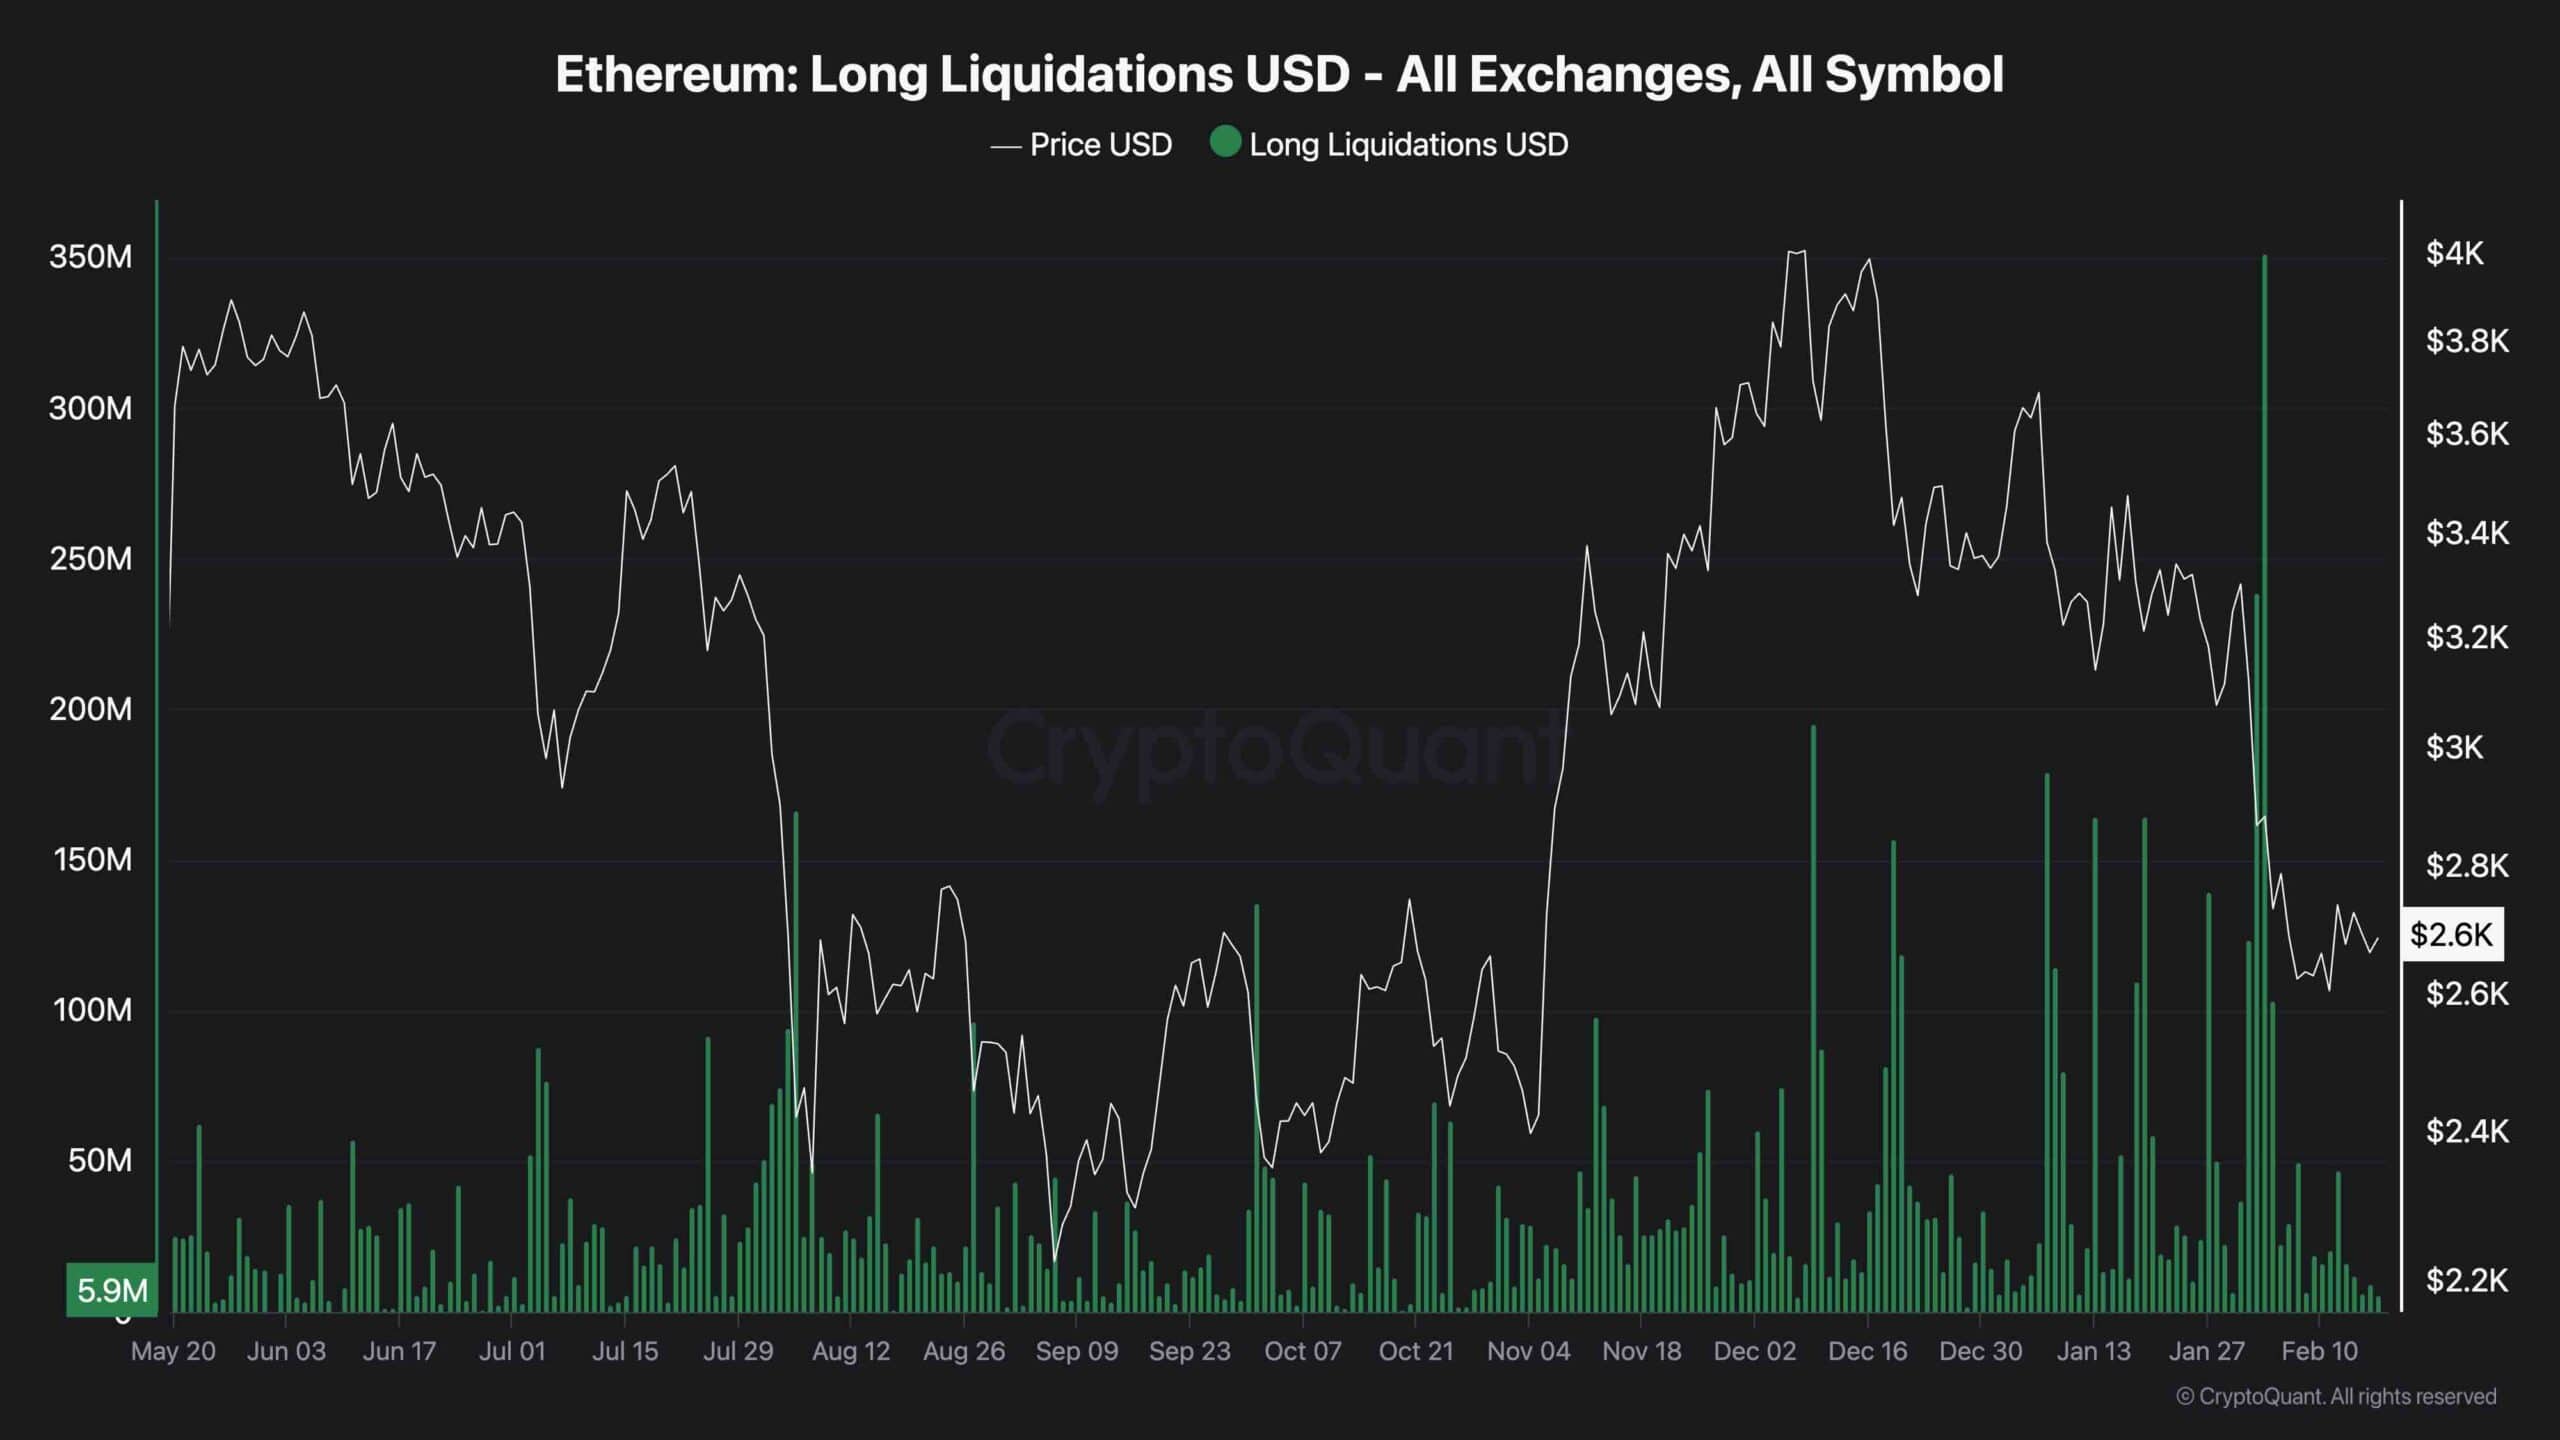
Ethereum recently faced a dramatic market decline, leading to a long squeeze that wiped out a significant number of leveraged long positions, as shown in the chart. This event caused heightened volatility, but despite the sharp drop, the cryptocurrency managed to find strong support at the $2K level, indicating potential stabilization.
The recent liquidations have cooled the perpetual markets down, reducing excess leverage in doing so. This reset could pave the way for new demand, as cautious buyers step in at key support zones.
If Ethereum maintains above $2K and builds momentum, the current consolidation phase could transition into a fresh bullish wave, with $2.5K and $3K as key resistance levels. Short-term consolidation remains likely, but a breakout above these resistance levels could signal the next major trend move.
This article first appeared at CryptoPotato

