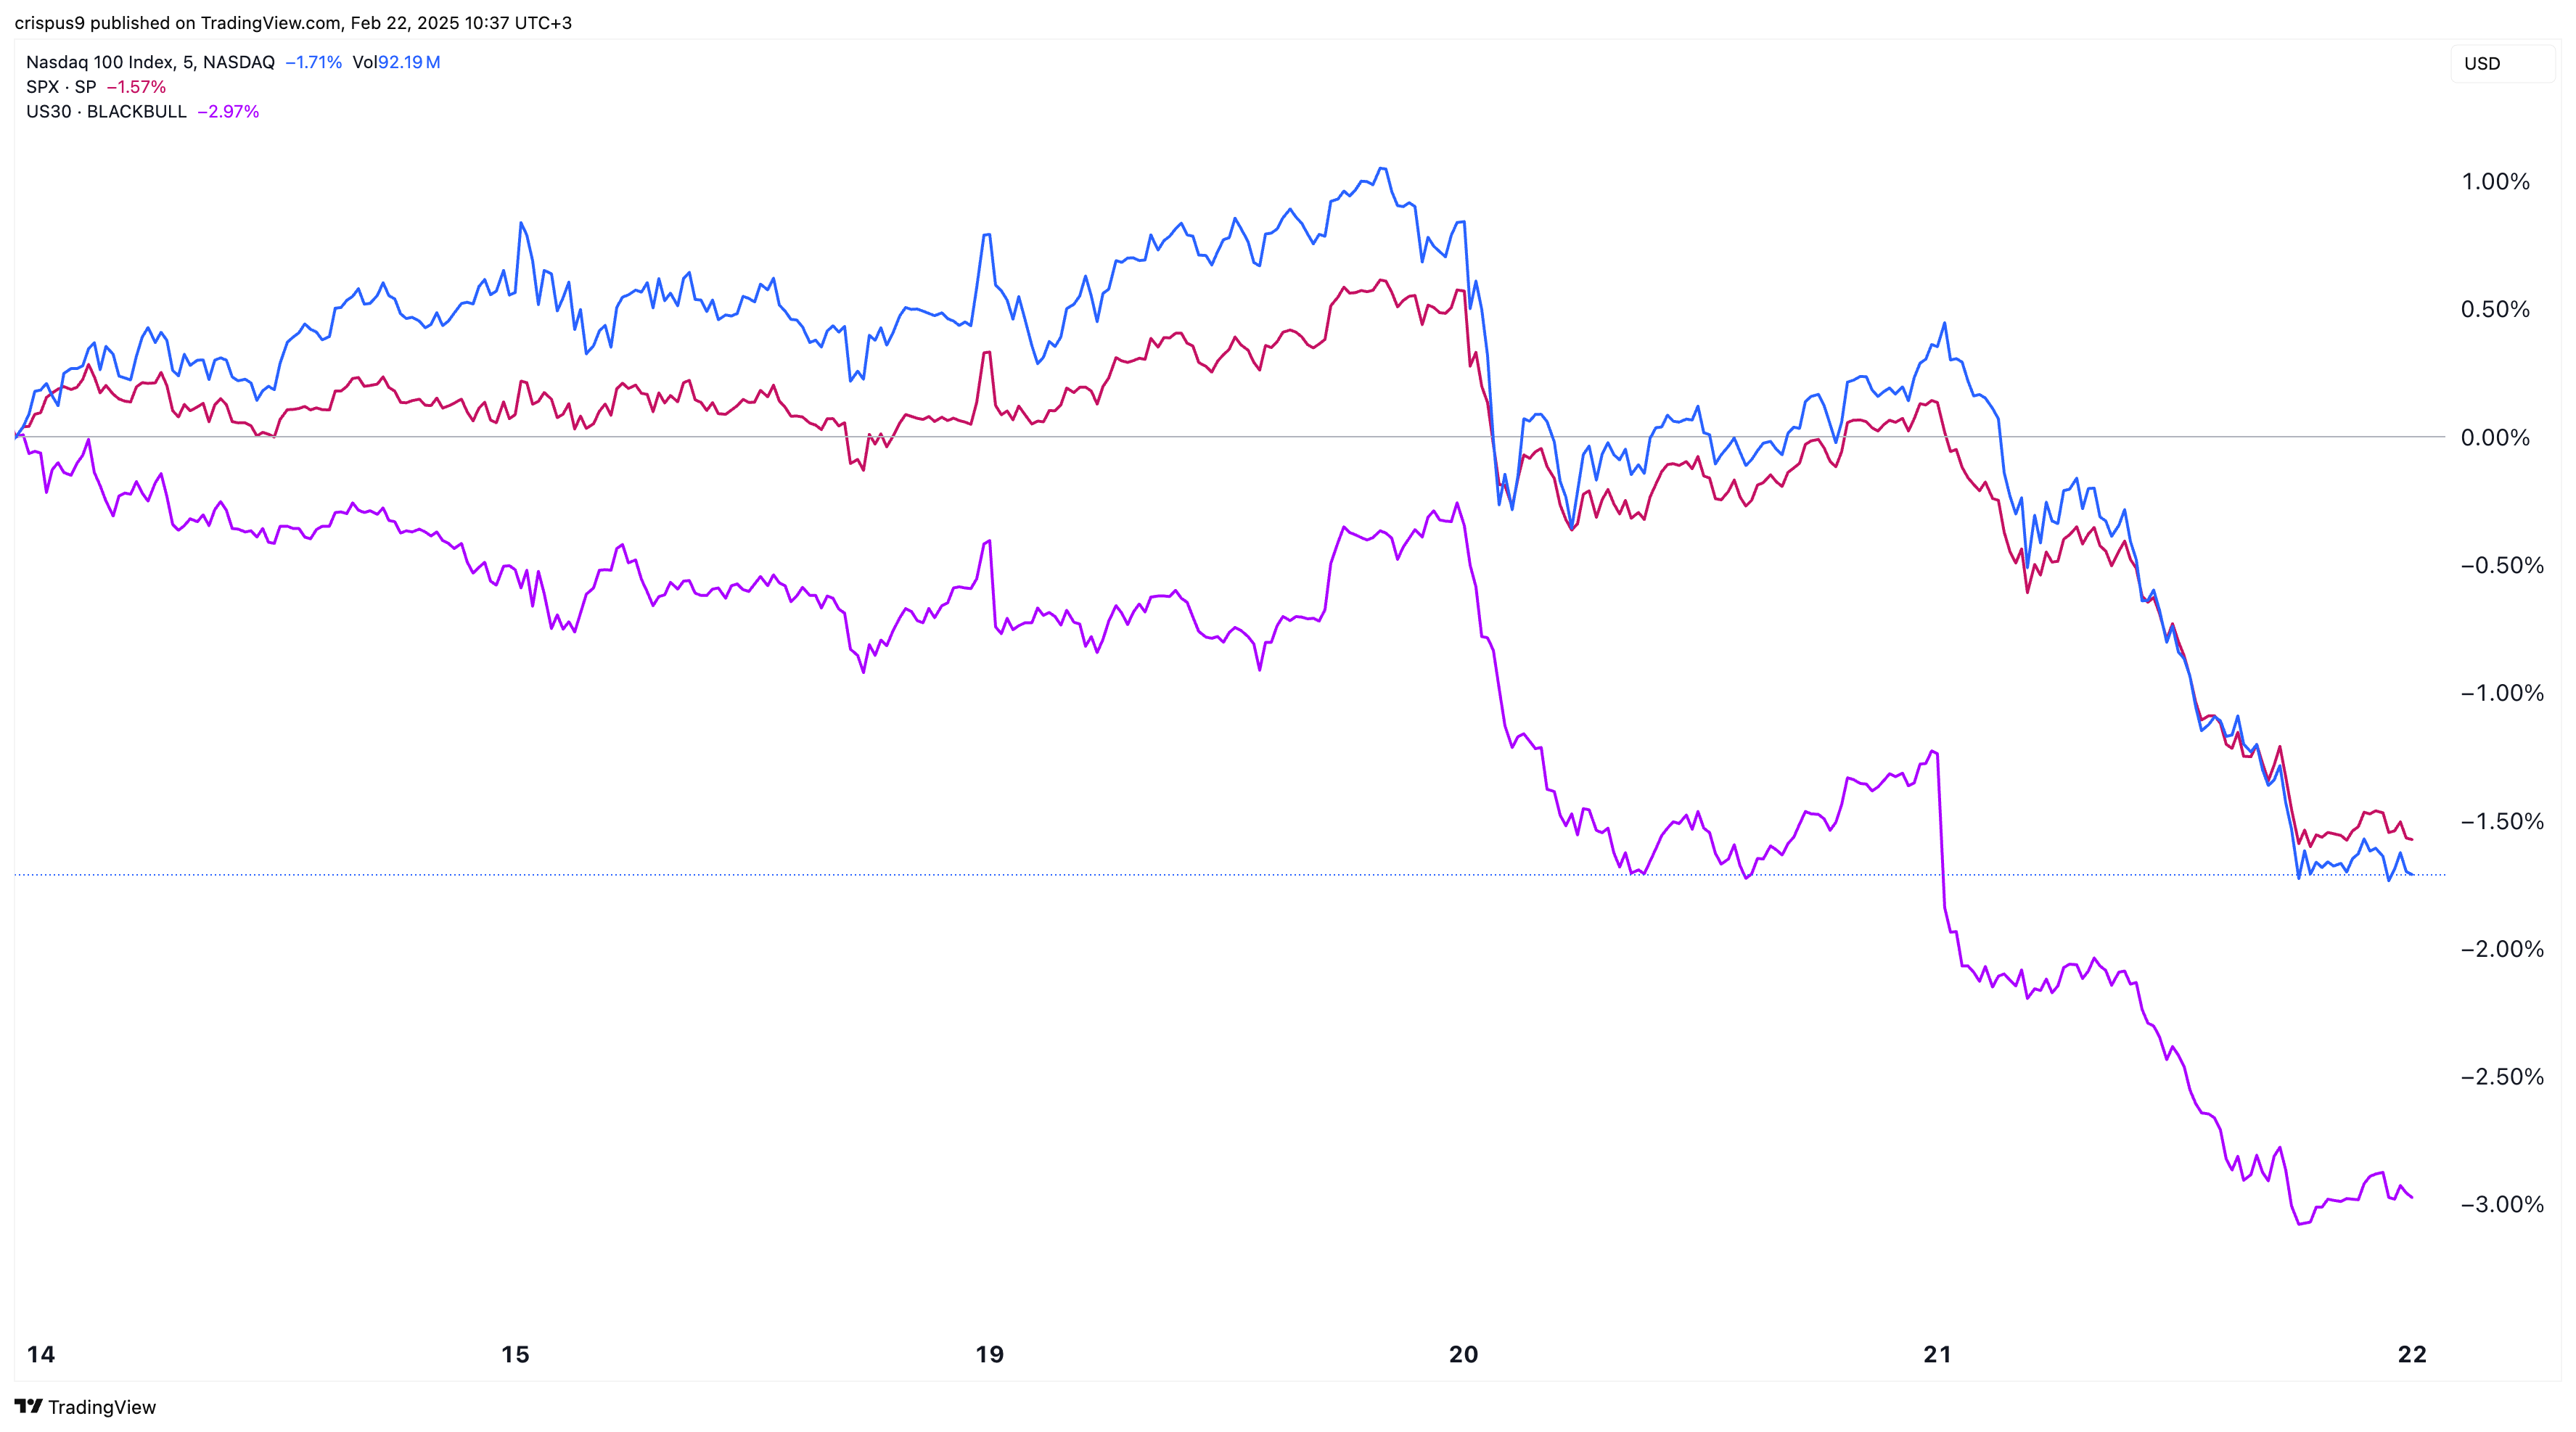
Bitcoin price held steady above $95,550 even as popular American stock indices and exchange-traded funds dived.
Bitcoin (BTC) was trading above $96,550 at last check Saturday morning, a day after U.S. equities had their worst day this year.
Nasdaq 100, S&P 500, and SCHD retreats
The blue-chip S&P 500 index dived by 1.71%, while the tech-heavy Nasdaq 100 fell by 2%, erasing 455 points. Similarly, the Dow Jones and the small-cap-weighted Russell 2000 fell by 1.70% and 3%, respectively.
The Schwab US Dividend Equity ETF fell by 0.5%. This ETF, known as the SCHD, tracks some of the biggest value stocks in the US and is highly popular among dividend income investors.

Many technology stocks, including Nvidia, Apple, Microsoft, and Meta Platforms were among the top laggards.
The CNN Money fear and greed index remained in the fear zone of 35, while the crypto fear and greed index moved to the greed area of 38.
Bitcoin and American equities have retreated because of the elevated market risk about President Donald Trump’s tariffs and the Federal Reserve.
This week’s Fed minutes showed that most officials favored maintaining a restrictive policy since inflation remains elevated. Data published earlier this month revealed that the headline and core consumer price index rose to 3% and 3.3% in January, moving further from the 2% target.
Bitcoin and other cryptocurrencies do well when the Federal Reserve has a dovish tone. For example, they crashed in 2022 as the bank hiked rates, but rebounded between 2023 and 2024 as the bank started its pivot.
Investors are also concerned about tariffs, likely leading to more market risks. Trump has already implemented tariffs on Chinese imports. Tariffs on Canada and Mexico, and steel and aluminum will kick off in March. He is also considering levies on European goods.
Higher tariffs will likely lead to stagflation, a period where high inflation is accompanied by slow growth rate. It is a difficult period since interest rate hikes to slow inflation lead to a slow economic growth, while rate cuts triggers higher inflation.
Bitcoin price chart points to a rebound

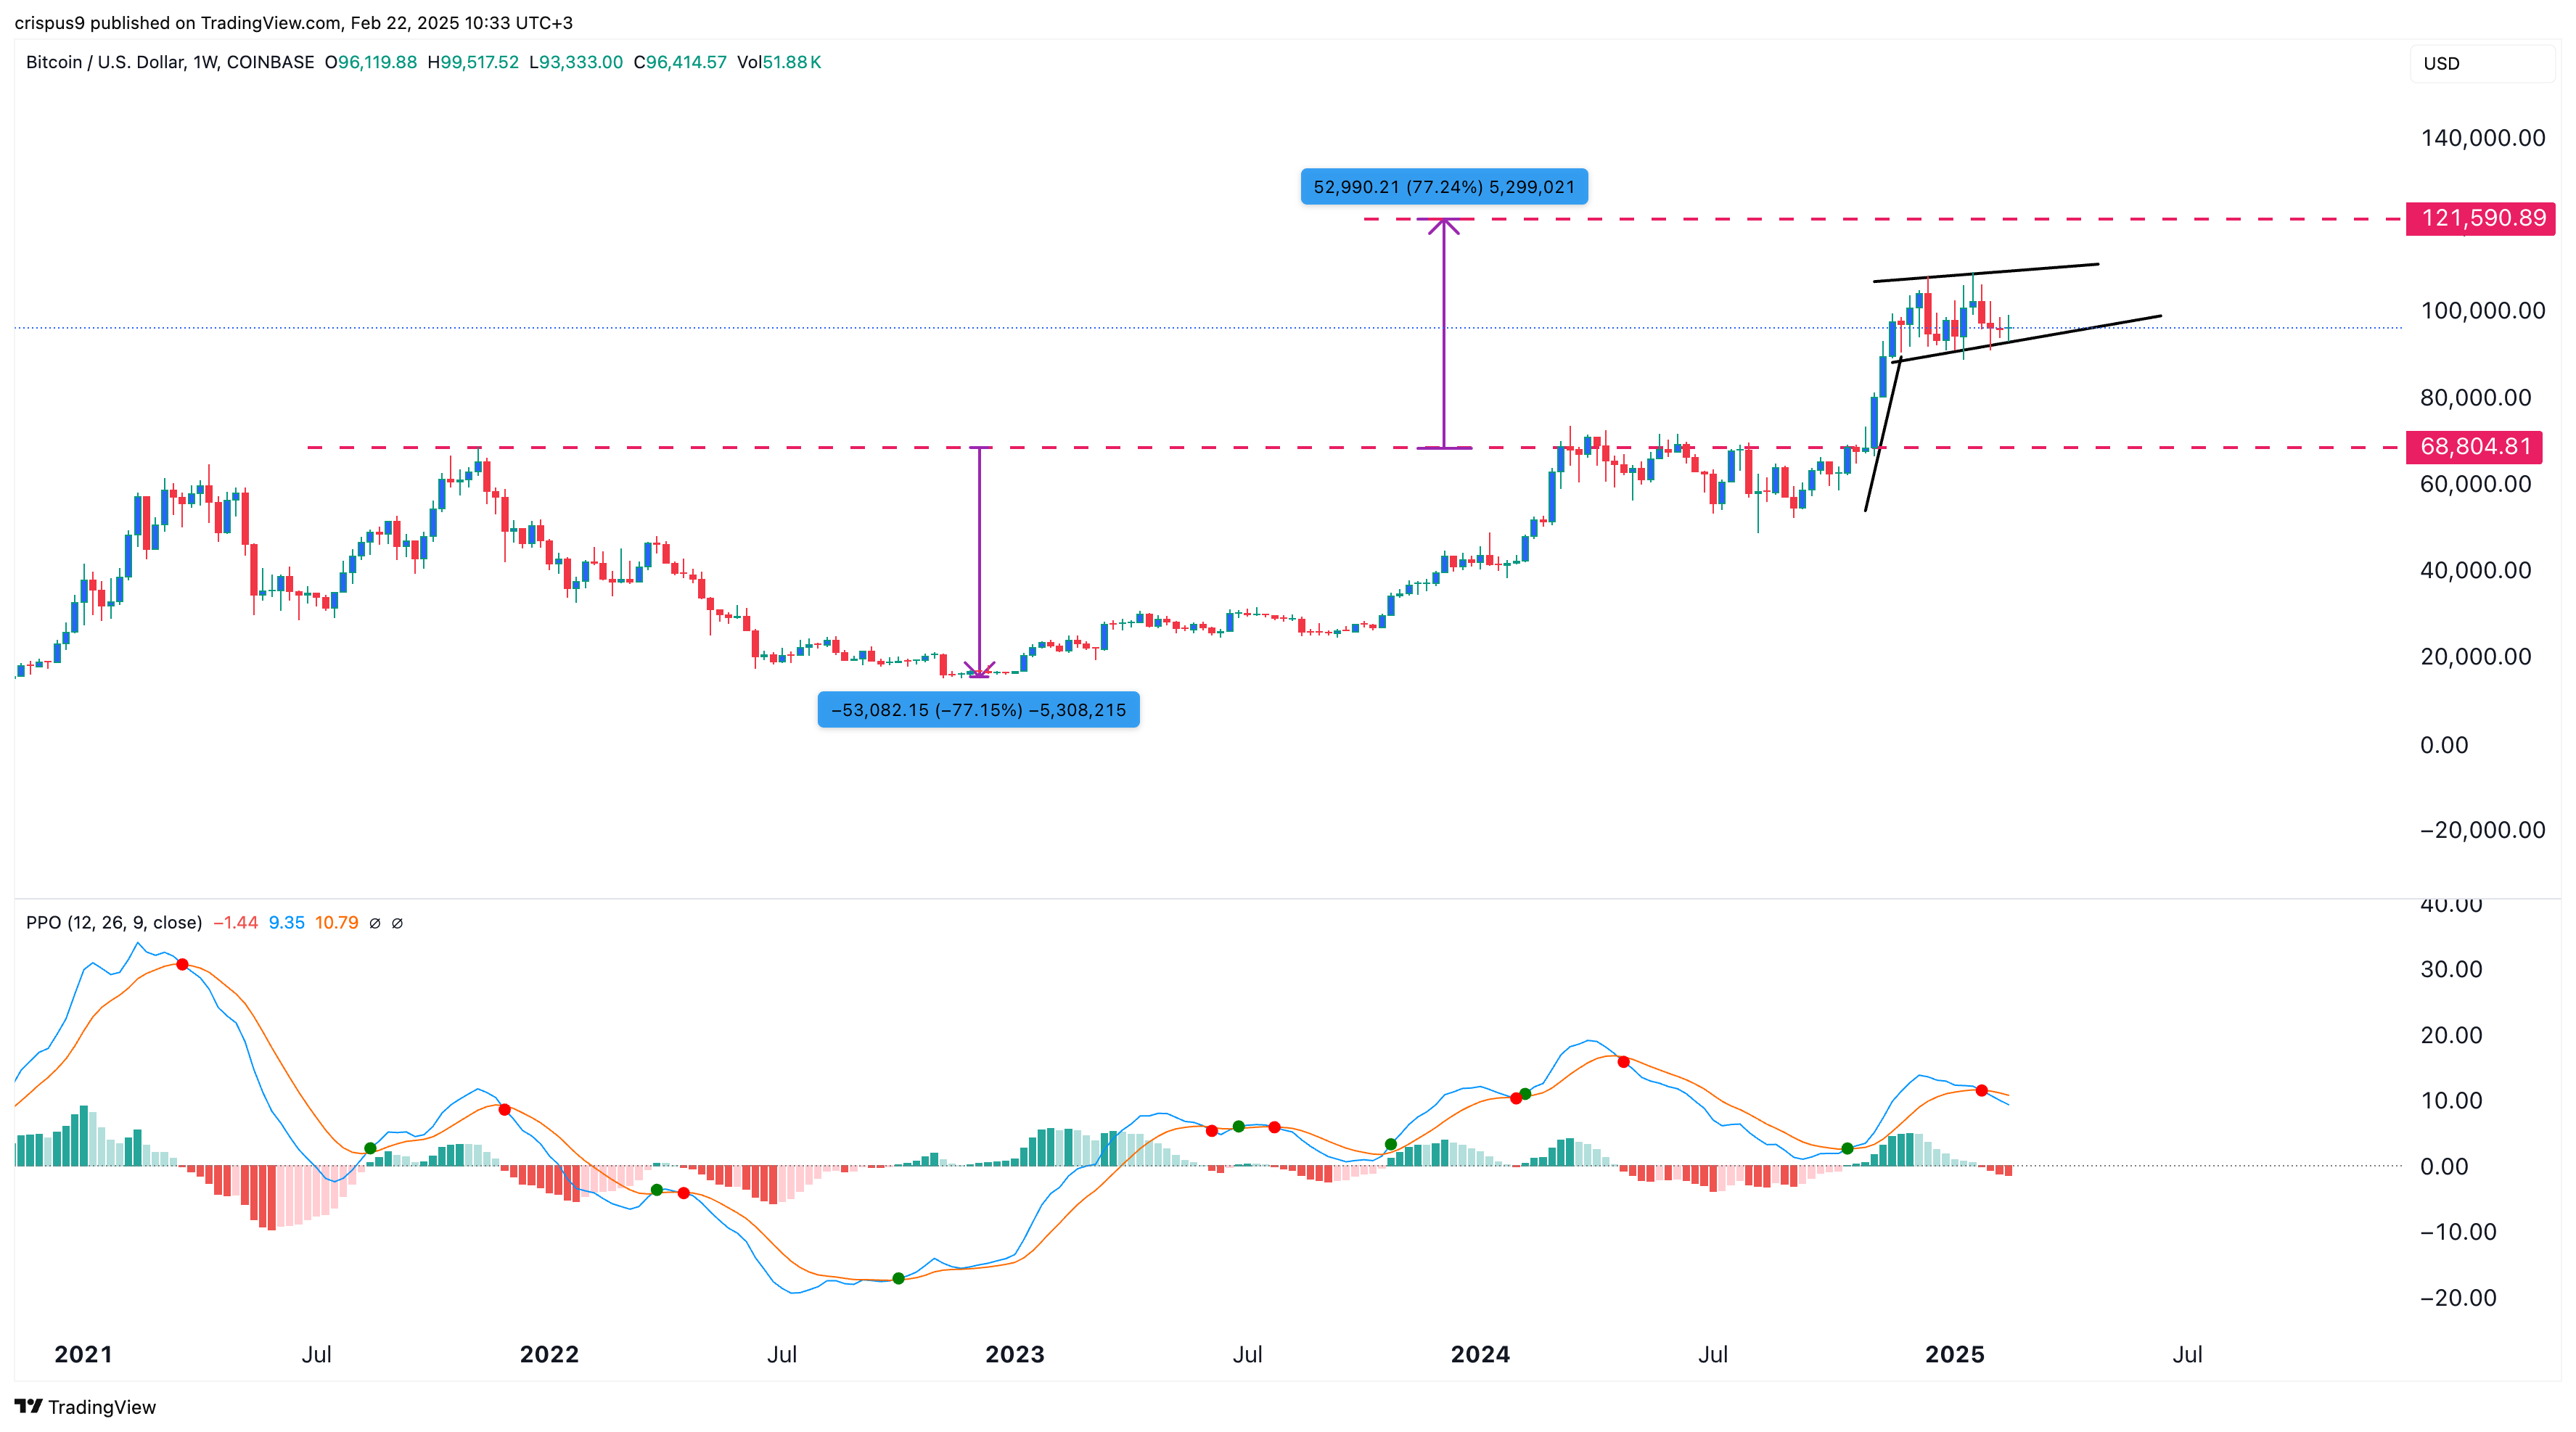
On the positive side, there are signs that Bitcoin price will stage a strong comeback in the coming weeks. The weekly chart shows that it has been forming a bullish flag pattern, which is made up of a tall vertical line and some consolidation. This pattern eventually triggers a strong bullish breakout.
Before that, the Bitcoin price formed a cup-and-handle pattern. This cup has a depth of about 78%, meaning that the BTC price target is about $121,590. The target is established by measuring the distance from the cup’s upper side.
This article first appeared at crypto.news