Bitcoin sellers are facing challenges in breaking below the crucial 100-day moving average at $96K, resulting in a phase of market indecision.
This line remains a key battleground between bulls and bears, as price action around this threshold is expected to dictate the next major trend.
Technical Analysis
By Shayan
The Daily Chart
Bitcoin sellers continue to struggle to break below the key 100-day moving average at $96K, a historically significant support level where buyers have often stepped in. This zone remains a crucial battleground, as a successful defense by buyers could trigger renewed demand, driving the asset toward the pivotal $103K resistance.
However, bearish risks persist, as a decisive breakdown below this support could spark liquidations in the futures market, intensifying selling pressure. Until a clear breakout occurs, traders should brace for heightened volatility and sharp price swings within this range.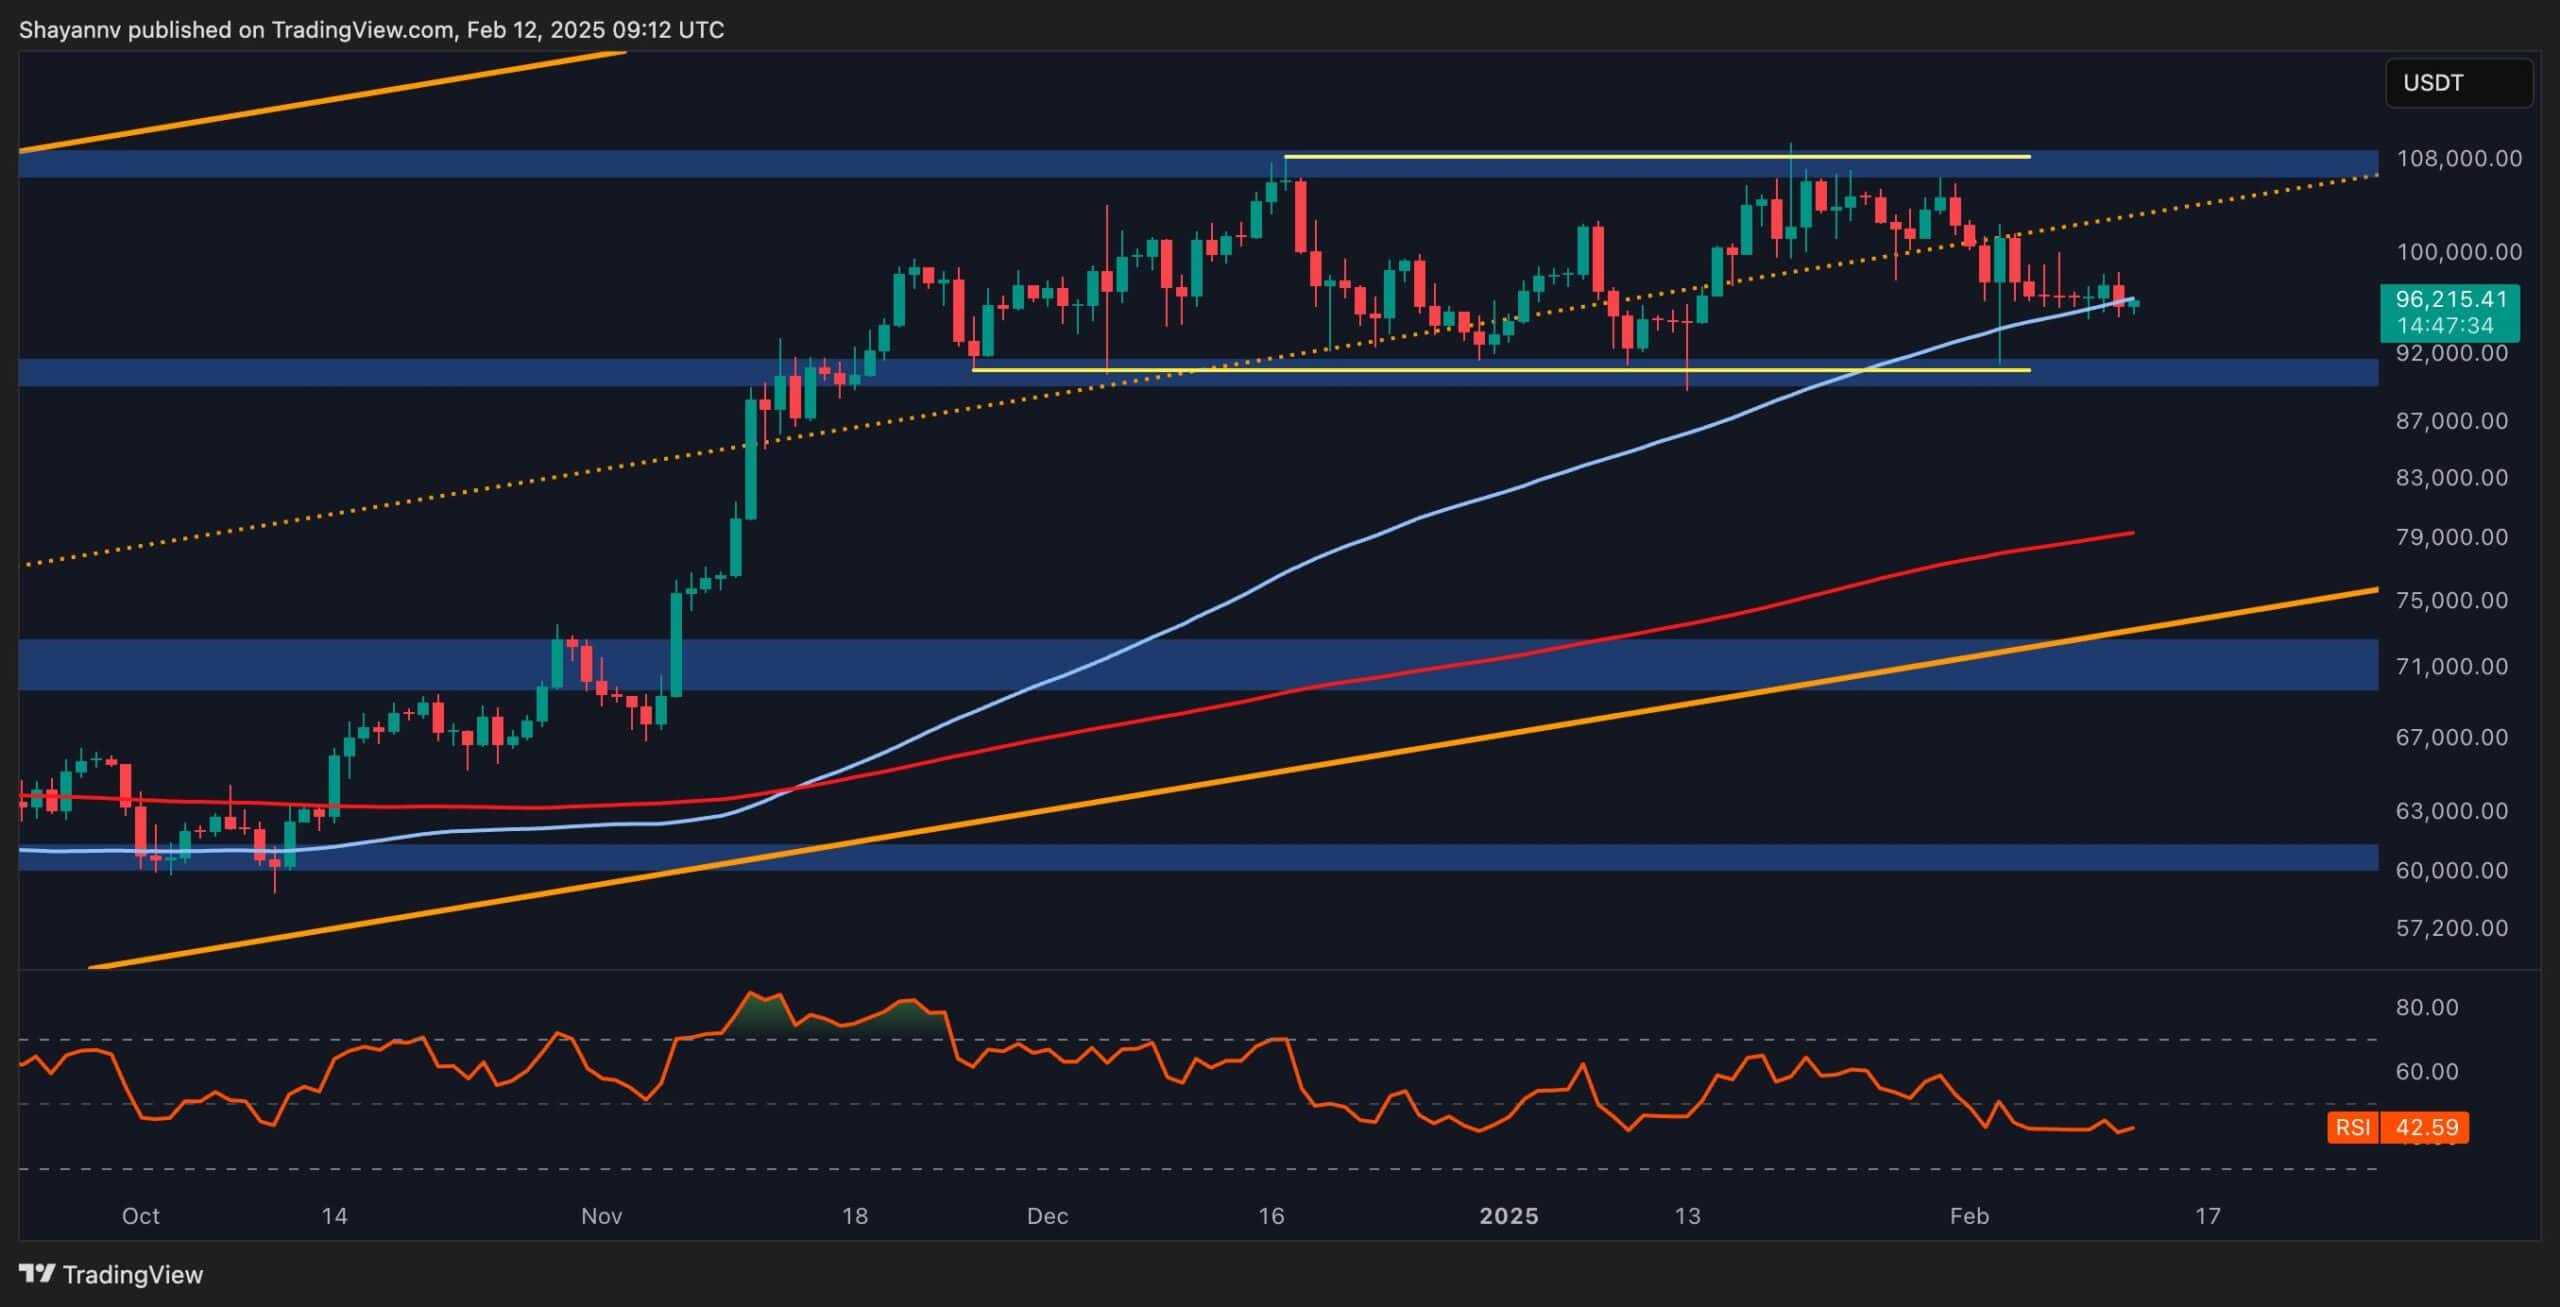
The 4-Hour Chart
On the lower timeframe, BTC remains trapped within a bullish continuation flag, with price action exhibiting signs of uncertainty. The lower boundary of this pattern has provided temporary support, but a decisive push above the $100K resistance is needed to confirm bullish momentum toward the $108K all-time high.
Despite optimism surrounding this formation, buying power remains insufficient to fuel a breakout, underscoring the need for stronger demand. Multiple support zones beneath the current price provide a buffer against downside risks, increasing the probability of a rebound. If bullish momentum strengthens, the next key milestone will be the psychologically significant $100K level.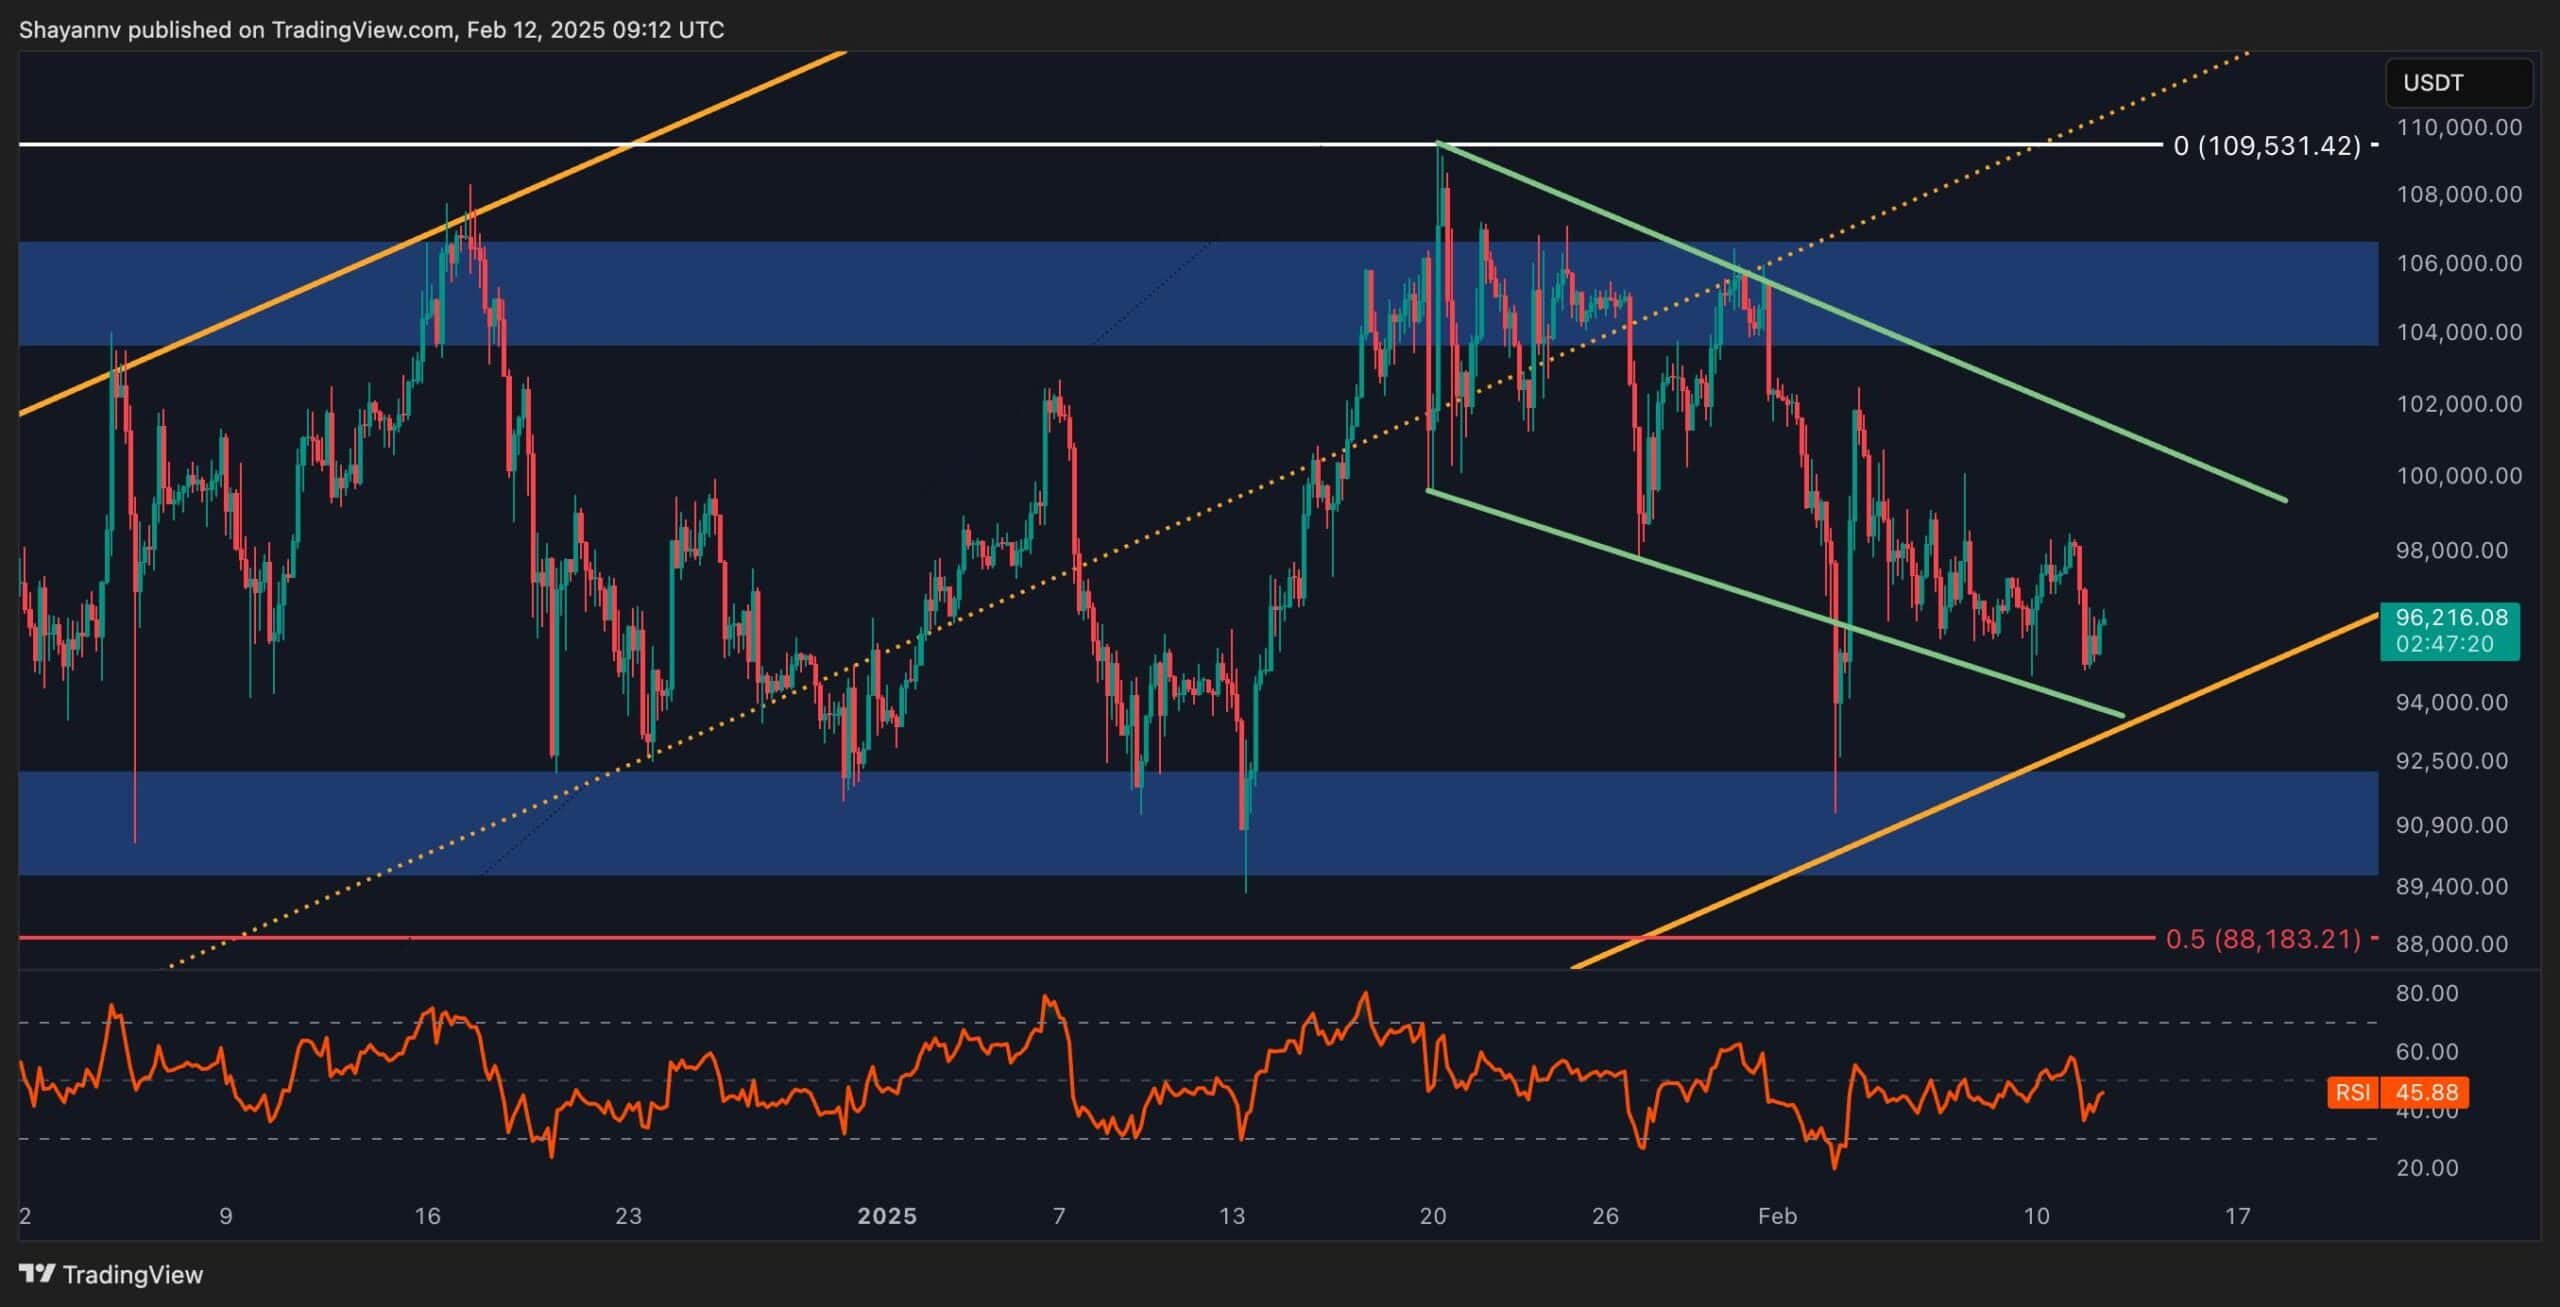
Sentiment Analysis
By Shayan
Bitcoin’s recent indecisive price action has left investors questioning what’s preventing the market from sustaining its upward momentum. A closer look at futures market metrics provides valuable insights.
The Bitcoin taker buy-sell ratio, which reflects whether buyers or sellers are placing more aggressive market orders, offers a possible explanation. As depicted in the chart, the 14-day moving average of this metric has shown a bullish reversal following a significant decline. This shift suggests that buyers are regaining strength and could soon take control of the futures market.
If this trend continues and the ratio surpasses the 1.0 threshold, it would signal an influx of buying pressure, potentially fueling the momentum needed for a renewed bullish rally.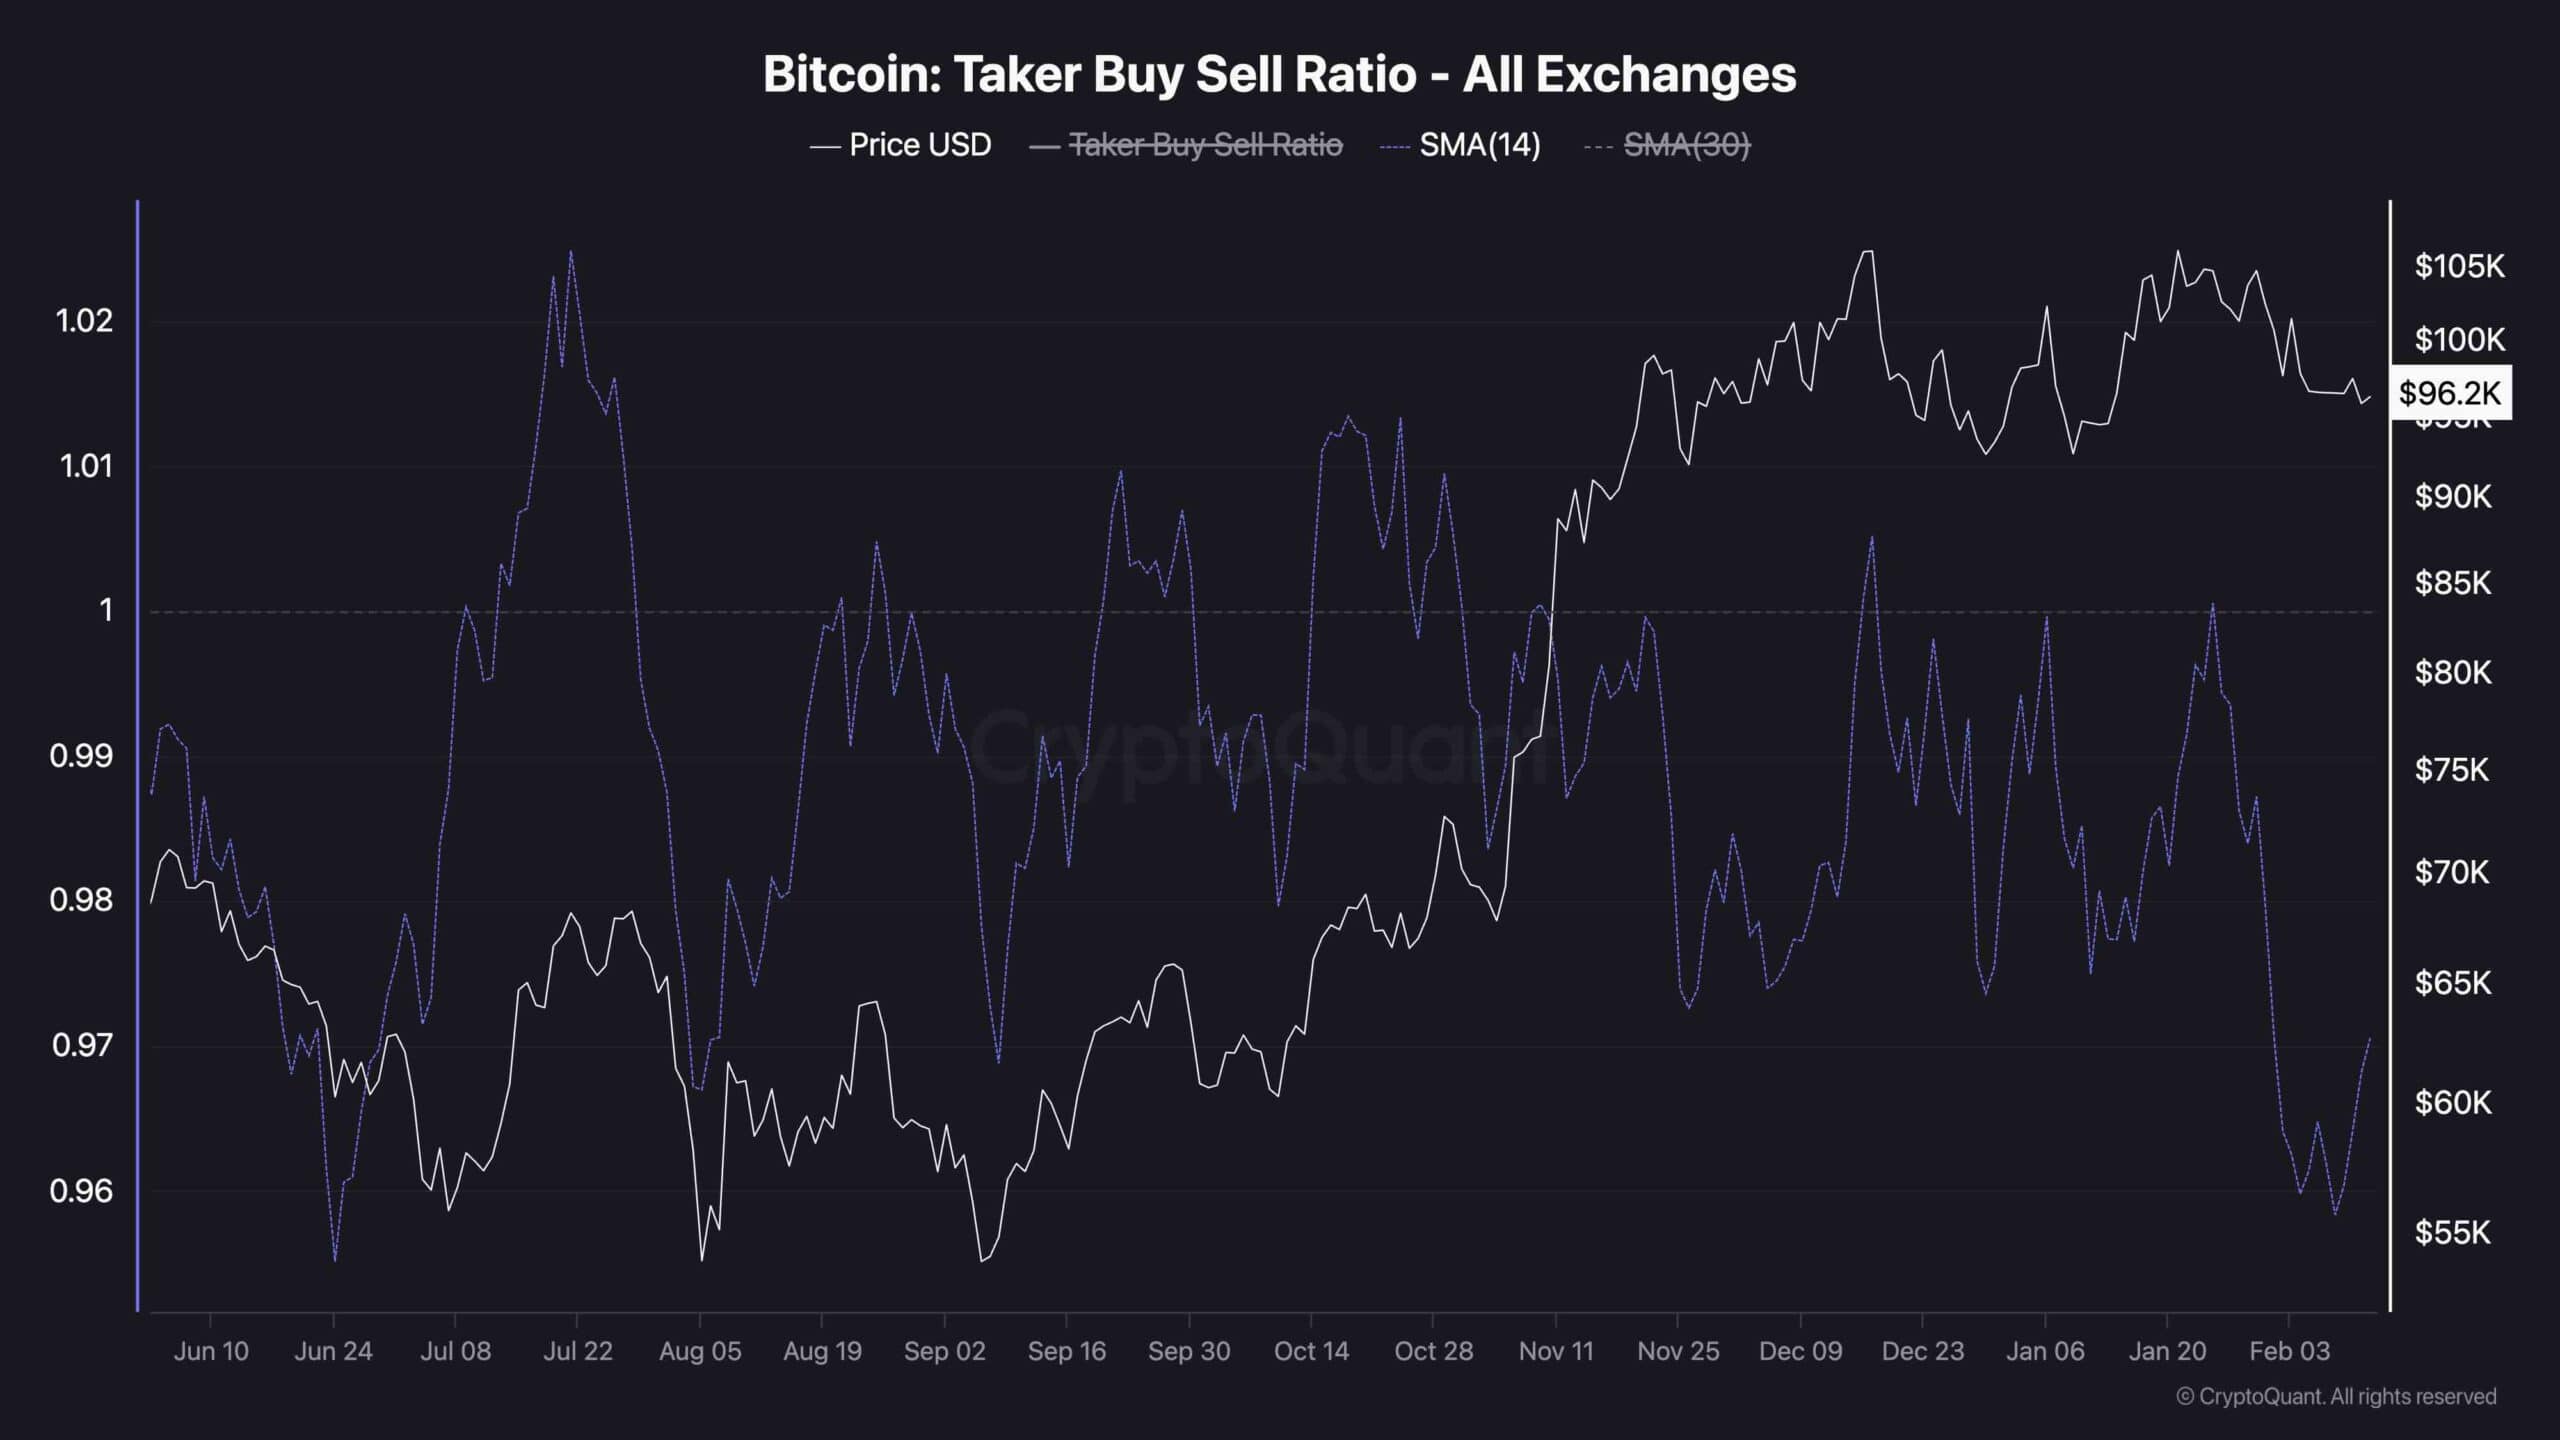
This article first appeared at CryptoPotato
