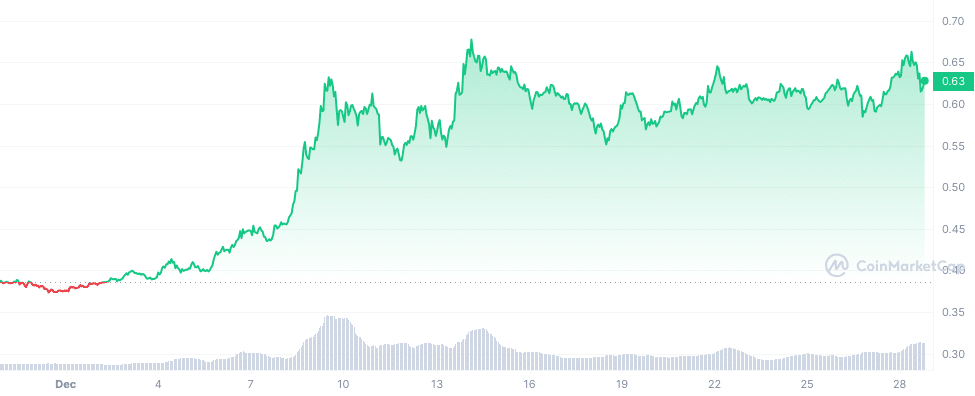
A YouTube analyst from Crypto Capital Venture believes Cardano could be breaking out from a multi-week symmetrical triangle pattern.
In his Dec. 28 YouTube video, the analyst analyzed the Cardano (ADA) charts in-depth. He believes that Cardano may be on the verge of a breakout from a symmetrical triangle pattern that has been forming over the past few weeks.
Specifically, the analyst pointed to ADA recently breaking through the triangle’s upper trendline, which he says could signal the start of a move upwards.
“I want to dissect the move right now and just talk about what I’m personally anticipating,” he commented.

However, he cautioned that ADA faces significant overhead resistance around its current price level. This includes the crucial 200-week moving average, which has historically acted as major resistance for Cardano. Plus, ADA is in overbought territory on the weekly time frame, meaning a pullback would not be unlikely.
“If ADA fails here on the daily, […] that’s okay because from a momentum oscillator perspective, from being overbought perspective, that’s in play,” the analyst remarked.
He explained that a drop would align with Cardano’s pullback patterns from the last cycle.
Nonetheless, the analyst believes that if ADA can power through the overhead resistance and continue upwards, it would mark a bullish shift from prior market cycles. He set a price target of $0.80 if the breakout sustains itself.
I’m very curious what happens with ADA right now, because not only the resistance we’ve talked about so far, but if you actually look at this red rectangle I’ve charted here, that’s the swing high that we had on December 13.
Crypto Capital Venture
This article first appeared at crypto.news

